
Chatbot for sky.money
An AI assistant that shipped inside a DeFi application, answering questions about a user’s positions and walking them through actions. My work was the layer that told us whether it was healthy: alarms, paging and dashboards, built from an empty infrastructure repository.
The backend is closed, so the drawings here are mine rather than screenshots. They are the shape of the thing, not its internals.
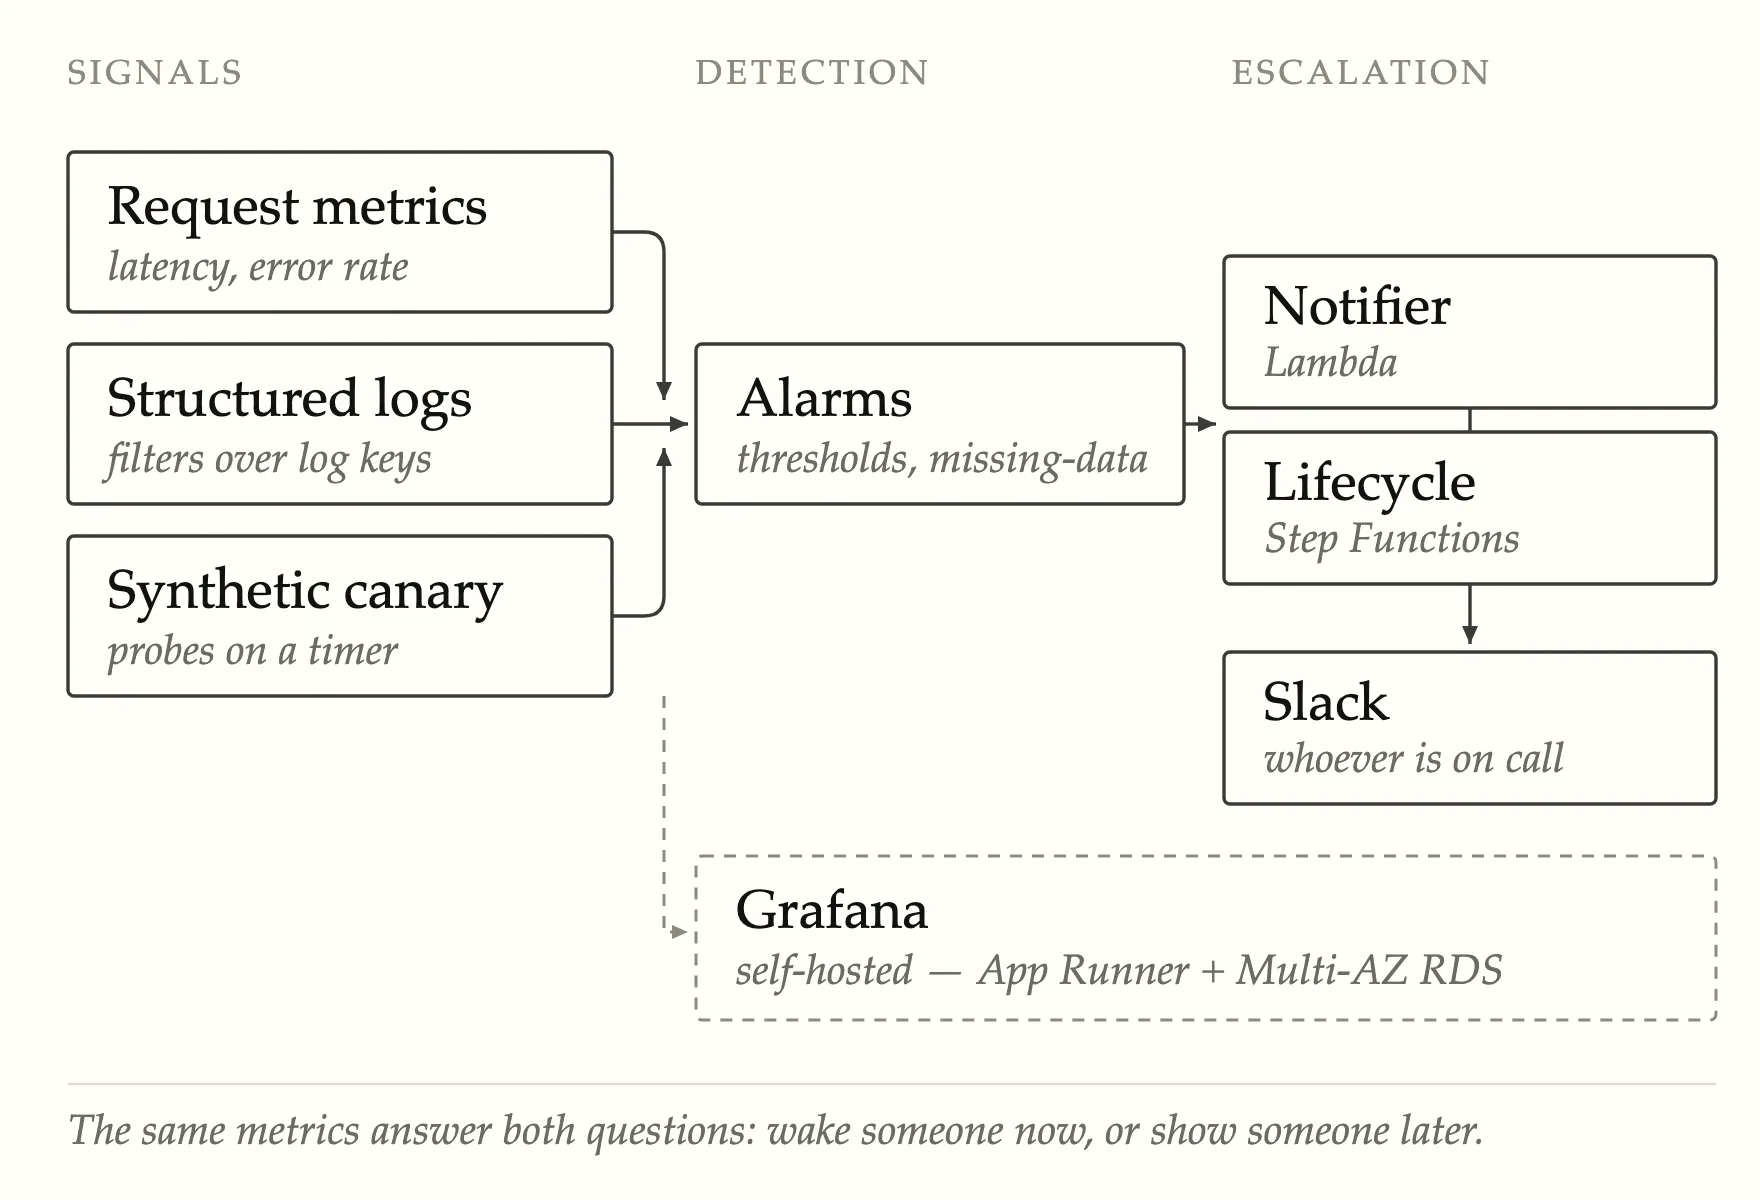
Signals a chat product actually has
A request-rate graph tells you almost nothing about an assistant. It can be up, fast, and answering badly. The useful signals were already being written into the application’s structured logs by the people building the model layer: whether a response tripped content filtering, whether sensitive data was detected, whether the thing the user asked for was understood at all.
Those were log lines, not metrics, so nothing could alarm on them. Metric filters turned the keys into first-class metrics, which made the safety and quality signals alarmable on the same footing as latency and errors. A canary probing the endpoint on a timer covered the case the other signals cannot: no traffic at all, which looks identical to a healthy quiet period until you go looking.
Making an alarm worth waking up for
The first thresholds were wrong in an instructive way. Latency here is log-normal (a long right tail is normal, not an incident), so percentile cutoffs picked off a Gaussian assumption fired constantly. Re-deriving them against the actual distribution is the difference between a page and a shrug.
Most of the work after the initial build was not adding alarms. It was a slow loop of watching what they did and taking the false ones away.
Low-traffic windows made alarms flap, because an absence of data was being read as a breach rather than as an absence. Client errors and server errors were alarming as one number, when a large share of the 4xx was the content filter correctly refusing something: expected behaviour, paging as though it were a fault. Lower-severity signals were firing on single bad intervals, so their evaluation periods were stretched until only a sustained problem could reach a human.
None of that is glamorous. It is the difference between an alerting system people trust and one they mute.
One incident, one thread
A first page is easy. What is harder is the hour after it, when nobody has answered yet and the system has to keep insisting without burying the channel.
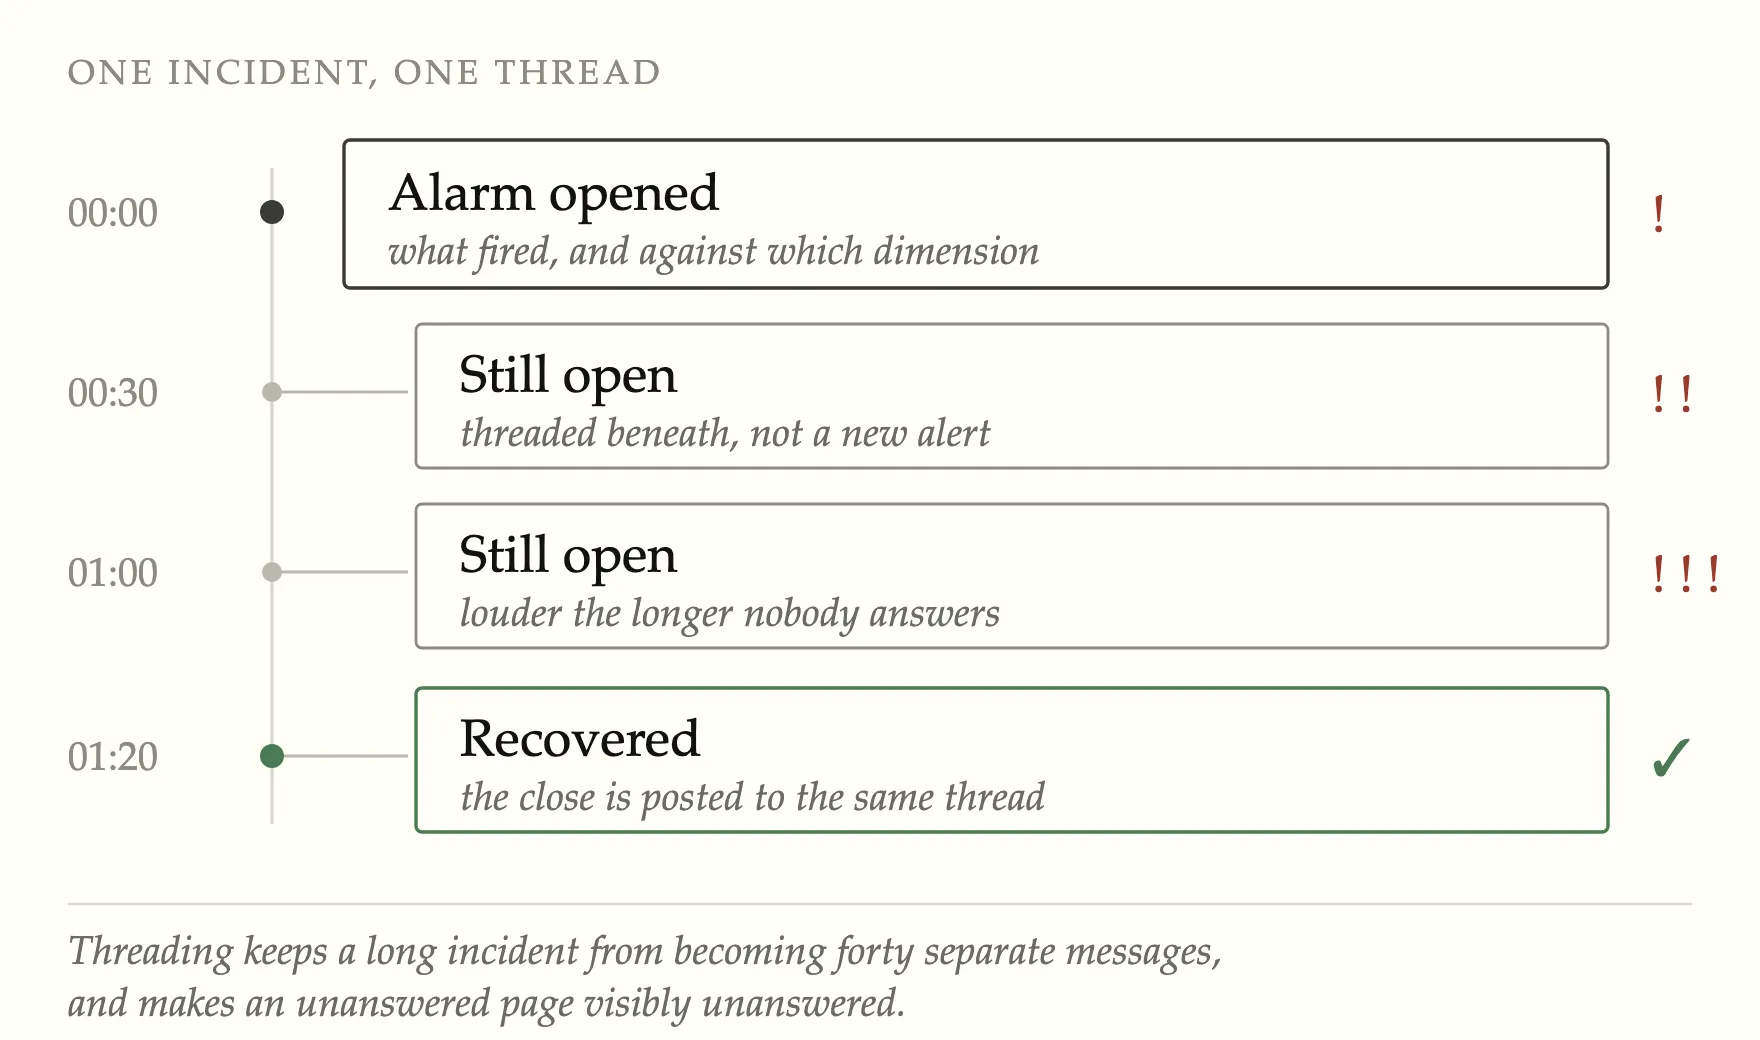
A state machine owns the lifecycle of each alert rather than the notifier firing and forgetting. Re-notifications land in the thread under the original message instead of as new messages, severity reads louder the longer an alert goes unanswered, and recovery is posted too, so a thread visibly closes.
One piece of this got built and then taken back out. An attempt to resolve alerts automatically kept getting the state wrong, because the upstream alarm-state API lagged reality by enough to matter. Reverting it was the right call: a paging system that lies about what has recovered is worse than one that makes you close things by hand.
Somewhere to look when nobody is paging
Dashboards started on the managed Grafana offering and moved off it. The reason was mundane and decisive: the work needed sharing with people outside the cloud account, the managed version could neither publish a dashboard publicly nor invite them, and it trailed upstream Grafana by several releases. The replacement is self-hosted on a container service with a Multi-AZ database behind it, fronted by a gateway and a real domain. Internal and externally shared views were split, so a dashboard meant for a wider audience could not accidentally carry metrics that were not for them.
The chatbot has since been retired. Its embedding frontend remains open source, but the chatbot code was removed; this page describes the system while it was running.