E.volution
e.volution visualizes a user’s email relationships with other people through time. Aimed as an excercise in data visualisation, the visualisation was developed in processing and works with GMail accounts.
On firing up e.volution, it asks for login details for a GMail account and then proceeds to show a 2D and a 3D visualization of how the user's inbox evolved over time.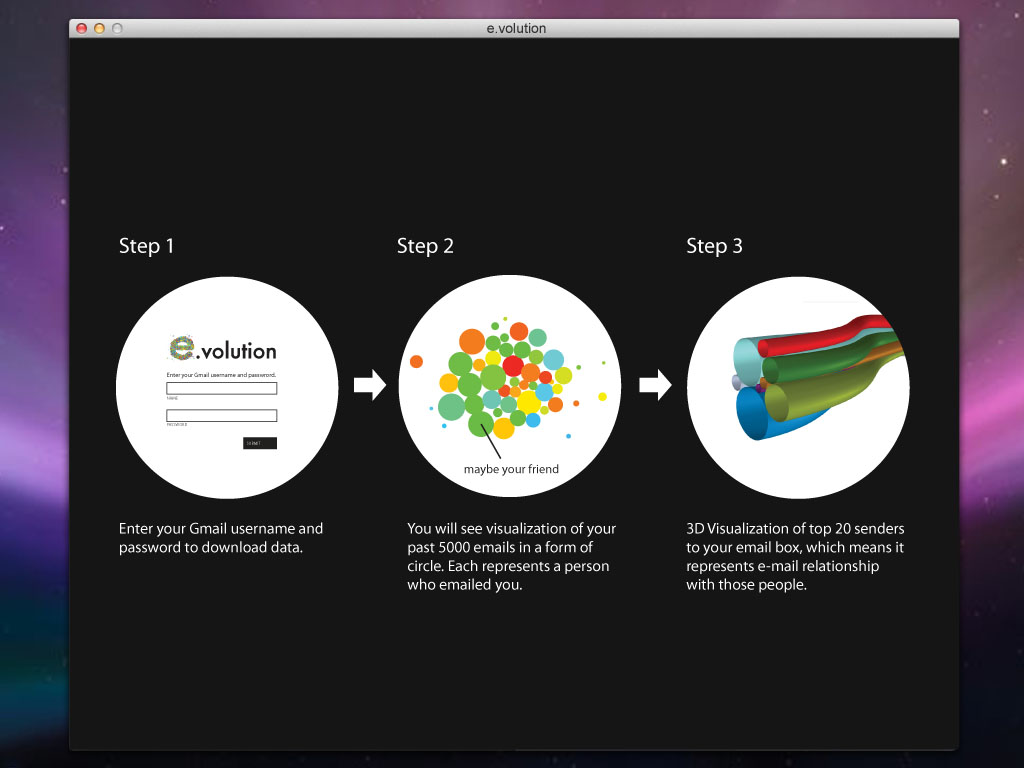 The login process is nothing spectacular. On logging in the first time, it requiers a while to download all the emails which are cached locally for future use, where the user can just enter the username and see the visualisation.
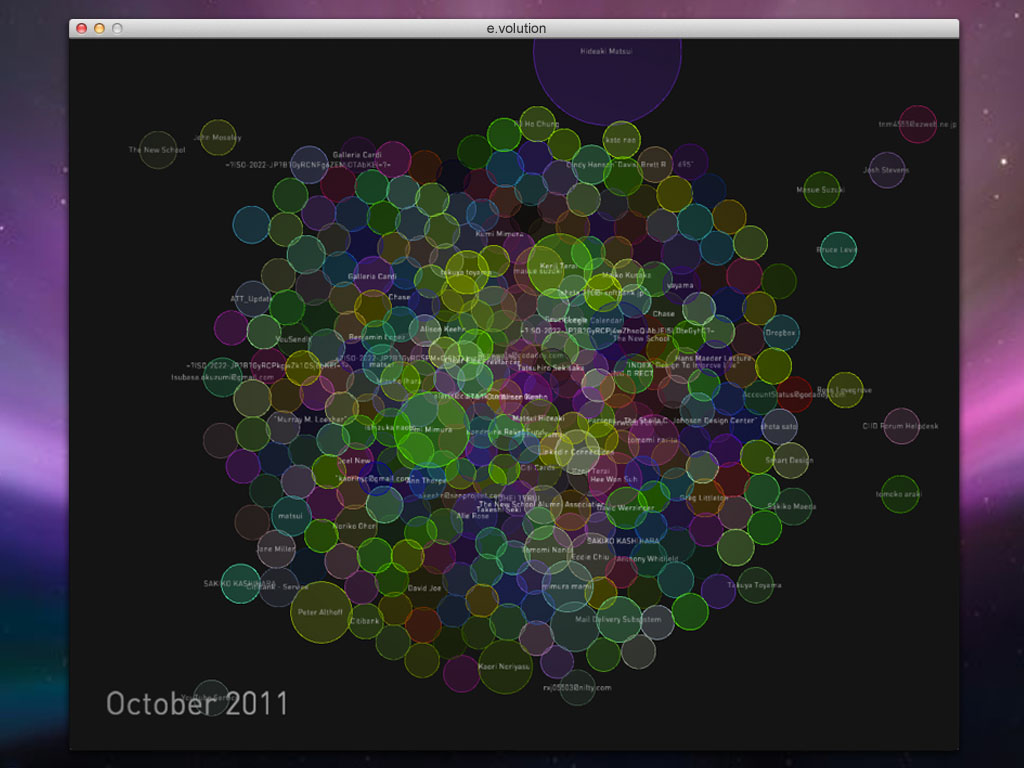
 The first visualization shows you the volume of emails from different people over time. Each circle represents a person, which grows or shrinks as correspondence evolves between you and them.
 A more experimental appraoch was stacking the circles with time to build volumes which can be inspected and interacted a more physical manner.
 It allows scrolling across time and seeing the results in an additive way, compared to only seeing one state at a time in the 2D animation.
 The user can also reduce the number of users in the visualisation and focus on only the main ones.
 The visualization can be panned anf rotated by the mouse, and this can be frozen as well. The time and number of users can be scrolled through visual elements or by keys on the keyboard as well.