
Metrics & Log Inventory
A telemetry pipeline will happily emit ten thousand distinct metrics and a terabyte of logs, and nobody in the organisation knows what most of it is. Two surfaces, built a few months apart, answering the same question of each half: what exists, where it came from, what it costs, and whether anything is actually reading it.
This is a different job from exploring telemetry or alerting on it, and it wants a different interface. Search answers “find me this”. An inventory has to answer “show me everything, ordered by how much of a problem it is”.
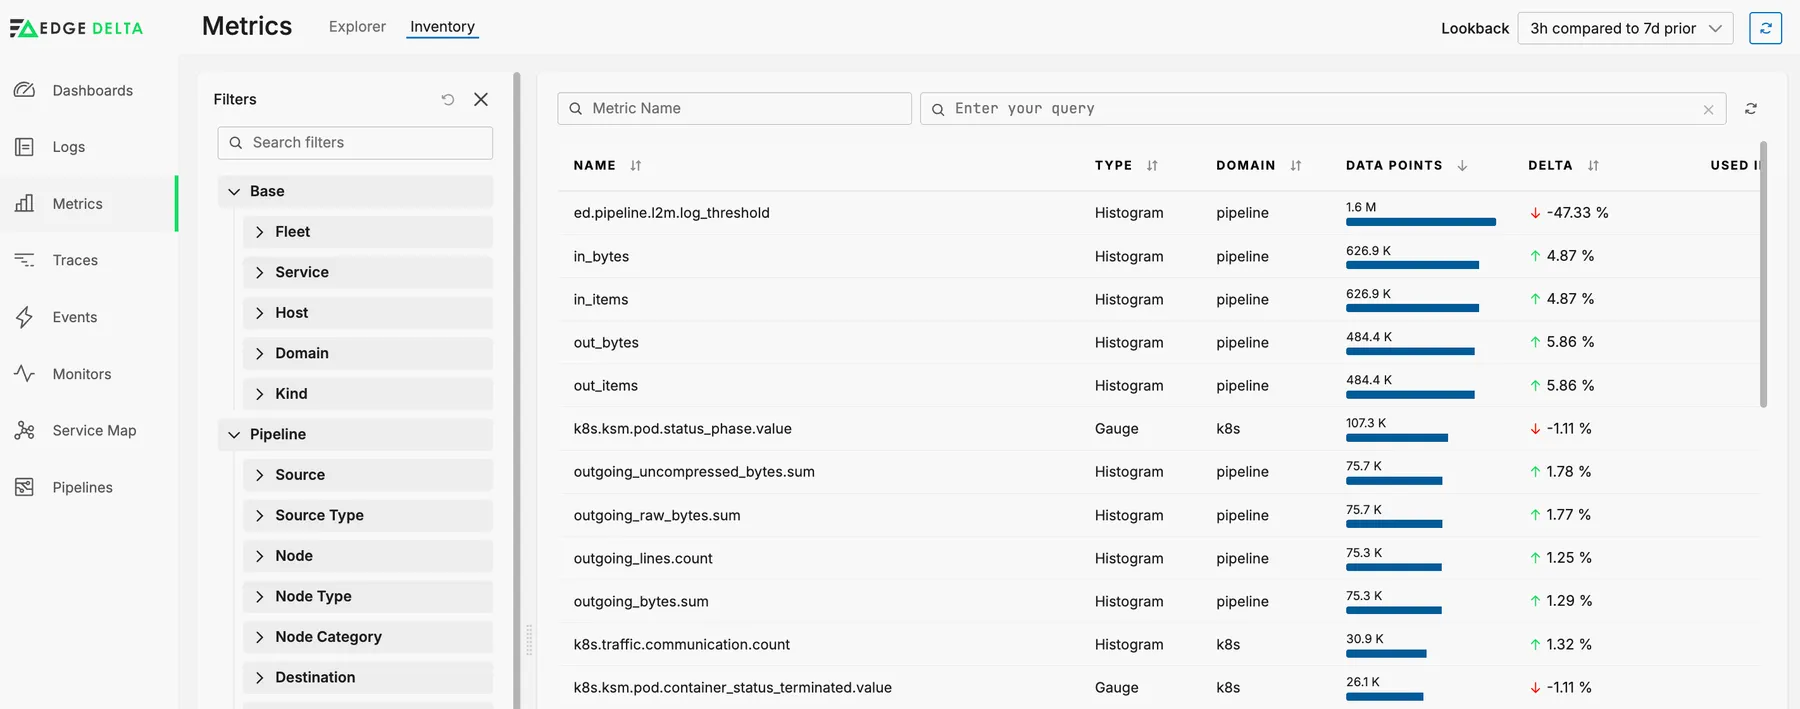
Metrics, where the cost is cardinality
Cardinality drives the bill in any metrics system and it grows by accident: a label that looked harmless multiplies every series it touches. So a metric opens onto its labels and the unique-value count for each, which is where an expensive one confesses.
The filter pane matters as much as the table. Metrics are grouped by where they came from rather than by name, because “show me everything this pipeline is producing” is the question people arrive with, and alphabetical order answers nothing.
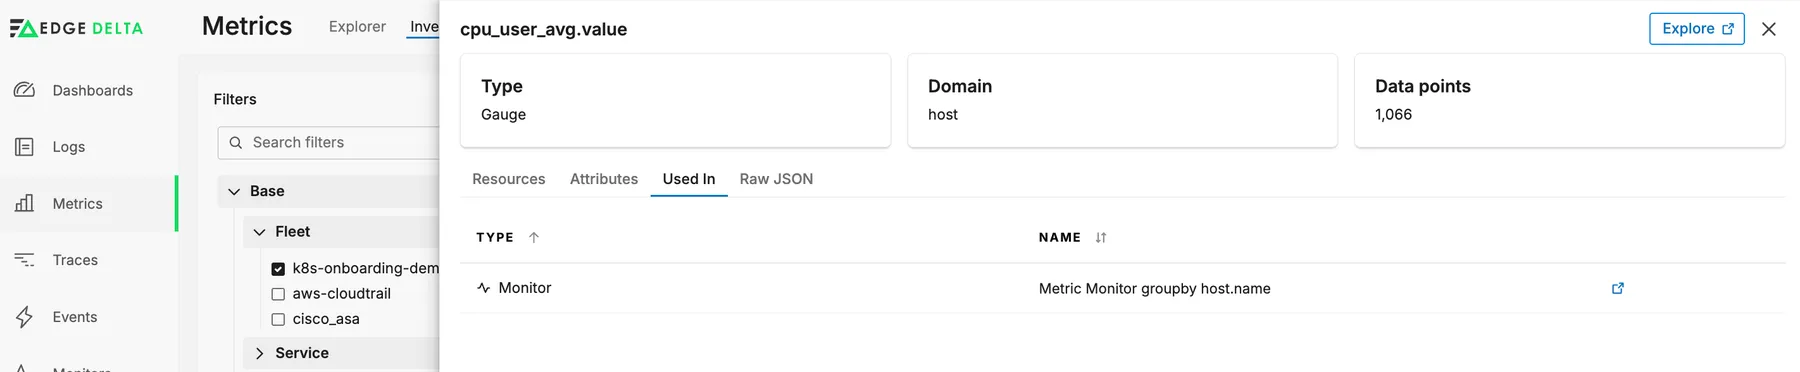
The tab that makes it safe to act on any of this: every monitor referencing a metric, listed. Deleting one nobody reads is housekeeping. Deleting one three alerts depend on is an incident you have scheduled for later, and the two should not look the same.
Logs, where the cost is volume
The same question, asked of a harder subject: metrics arrive with a name and a shape, logs as text in whatever quantity the services feel like producing.
So this table leads with volume: count and bytes per pipeline and service, with the size distribution beside it. A service quietly emitting a megabyte a second is invisible in a search interface and unmissable here.
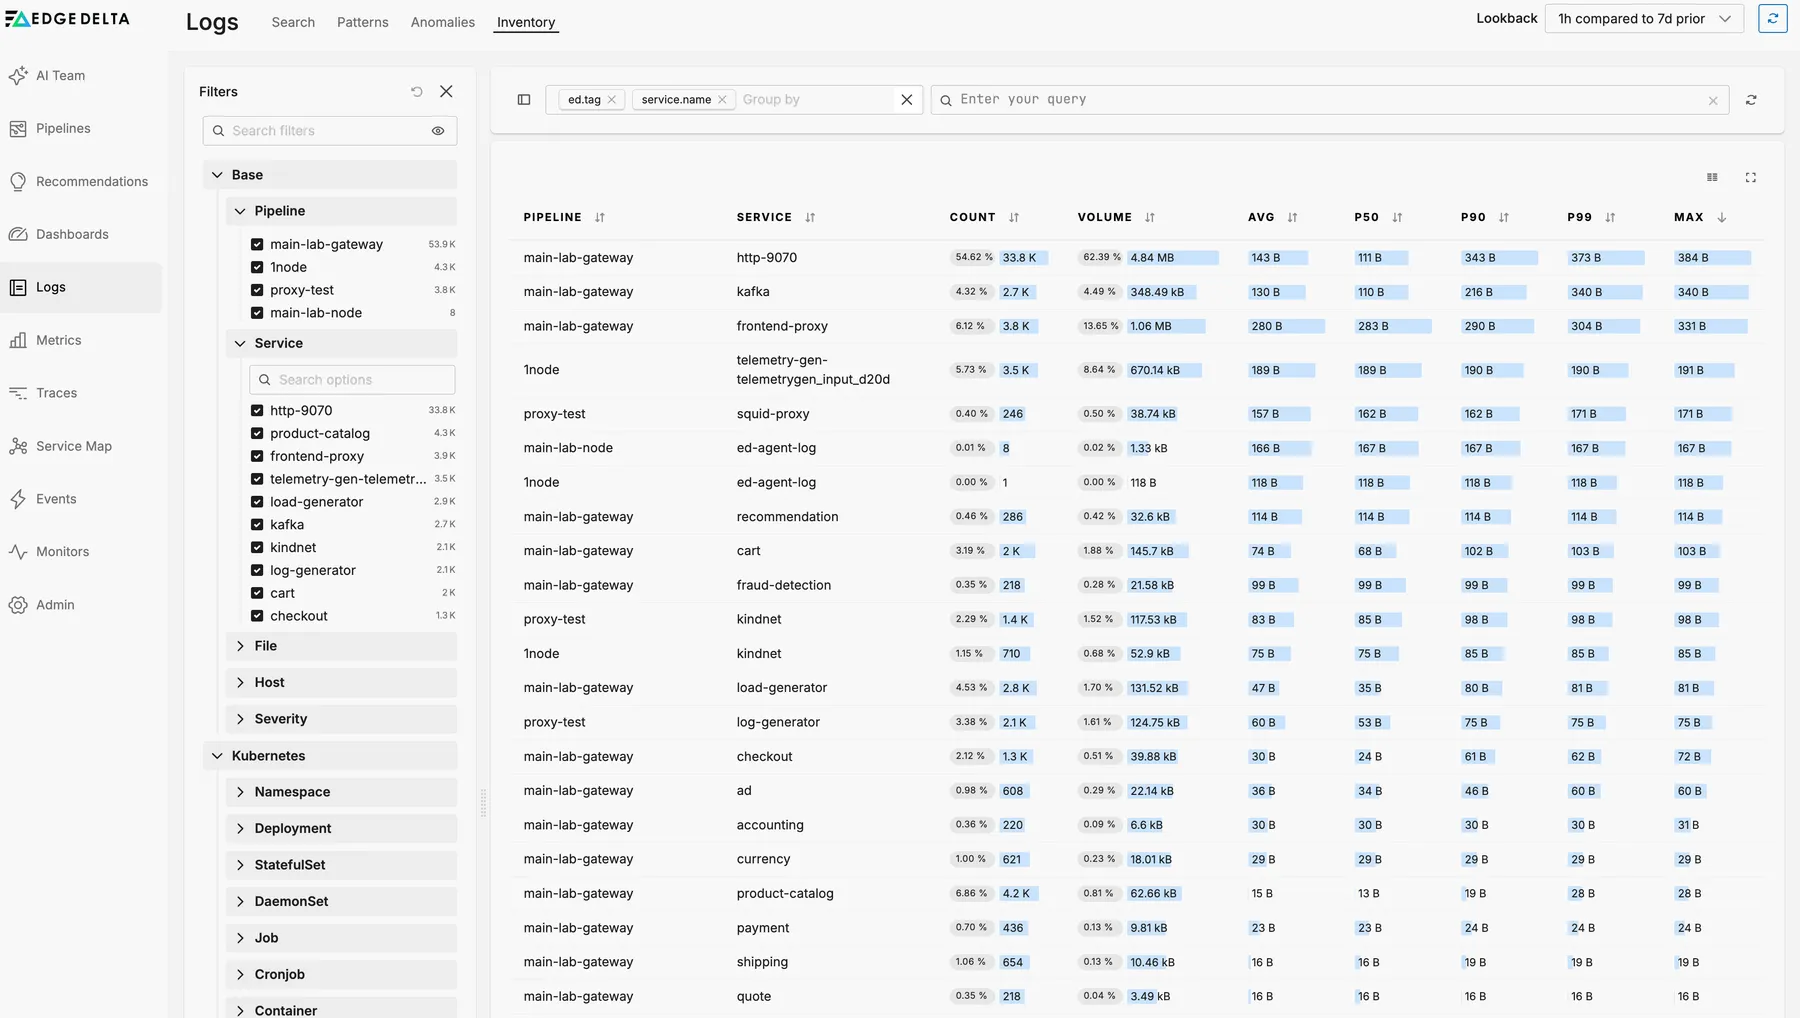
Percentiles rather than an average alone, because the mean size of a log line tells you very little. The gap between the median and the maximum is what says whether a service emits consistent records or occasionally dumps a stack trace with a payload attached.
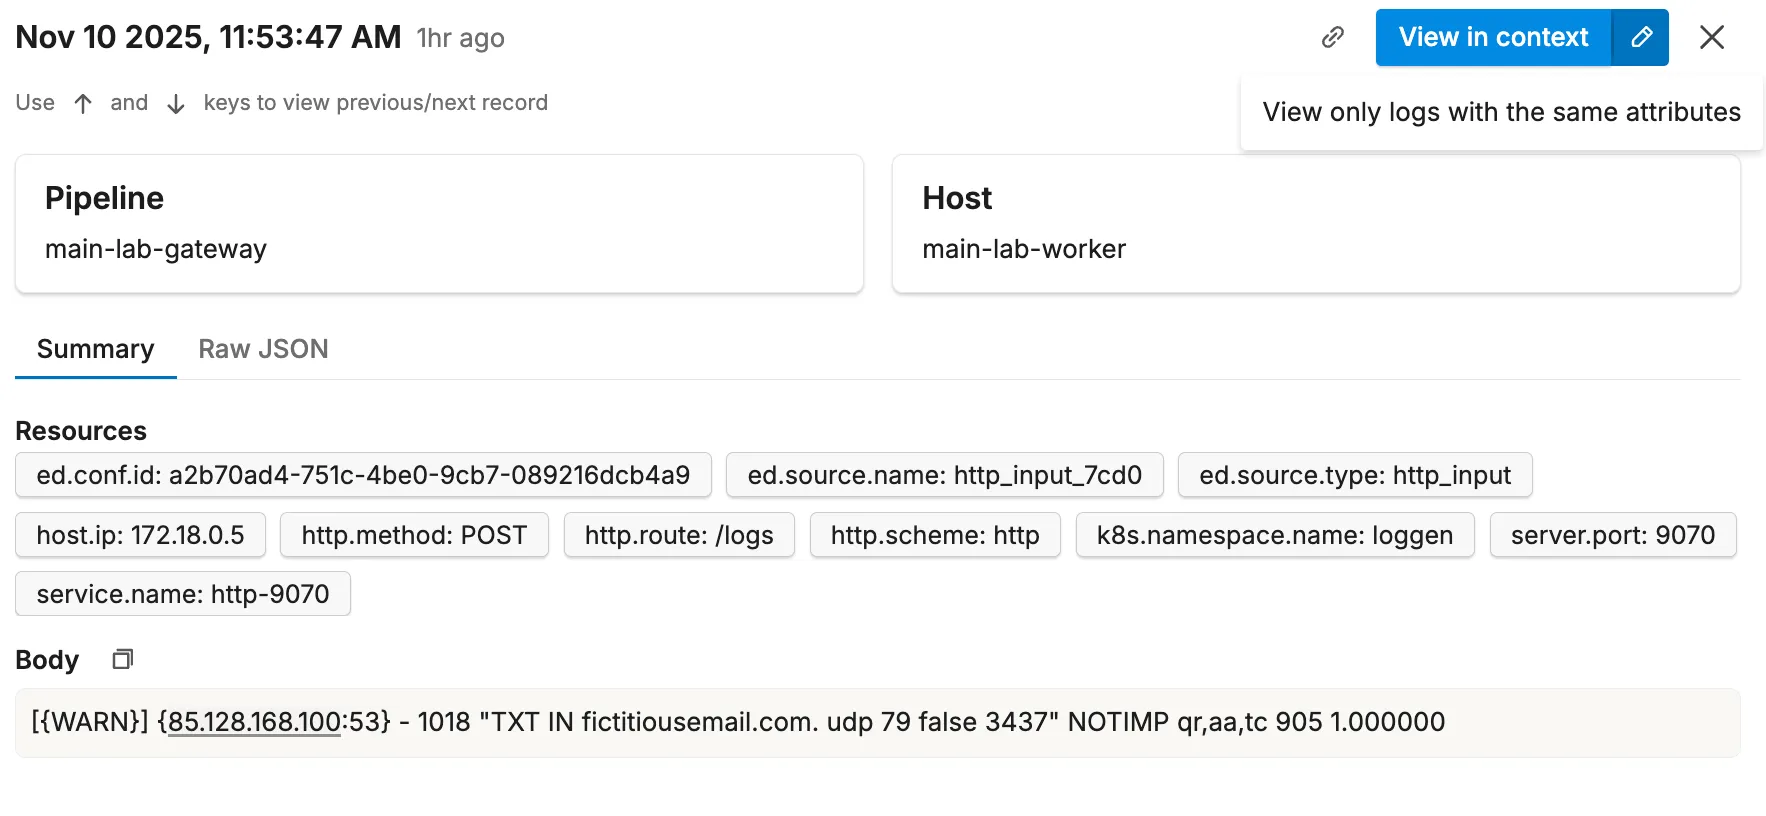
An inventory is a place to find something, not a place to debug it. So a sample carries its resource attributes as chips and a way back out: view only the logs sharing those attributes, in the ordinary search surface, filter already applied.
Neither surface is where the work gets done. The measure of both is how quickly someone leaves holding the one thing they came for.