
Metrics Explorer
A query and charting surface over every metric Edge Delta ingests or derives, rebuilt on the component system that came out of the React migration, and the place formulas landed first: arithmetic across metrics rather than one metric at a time.
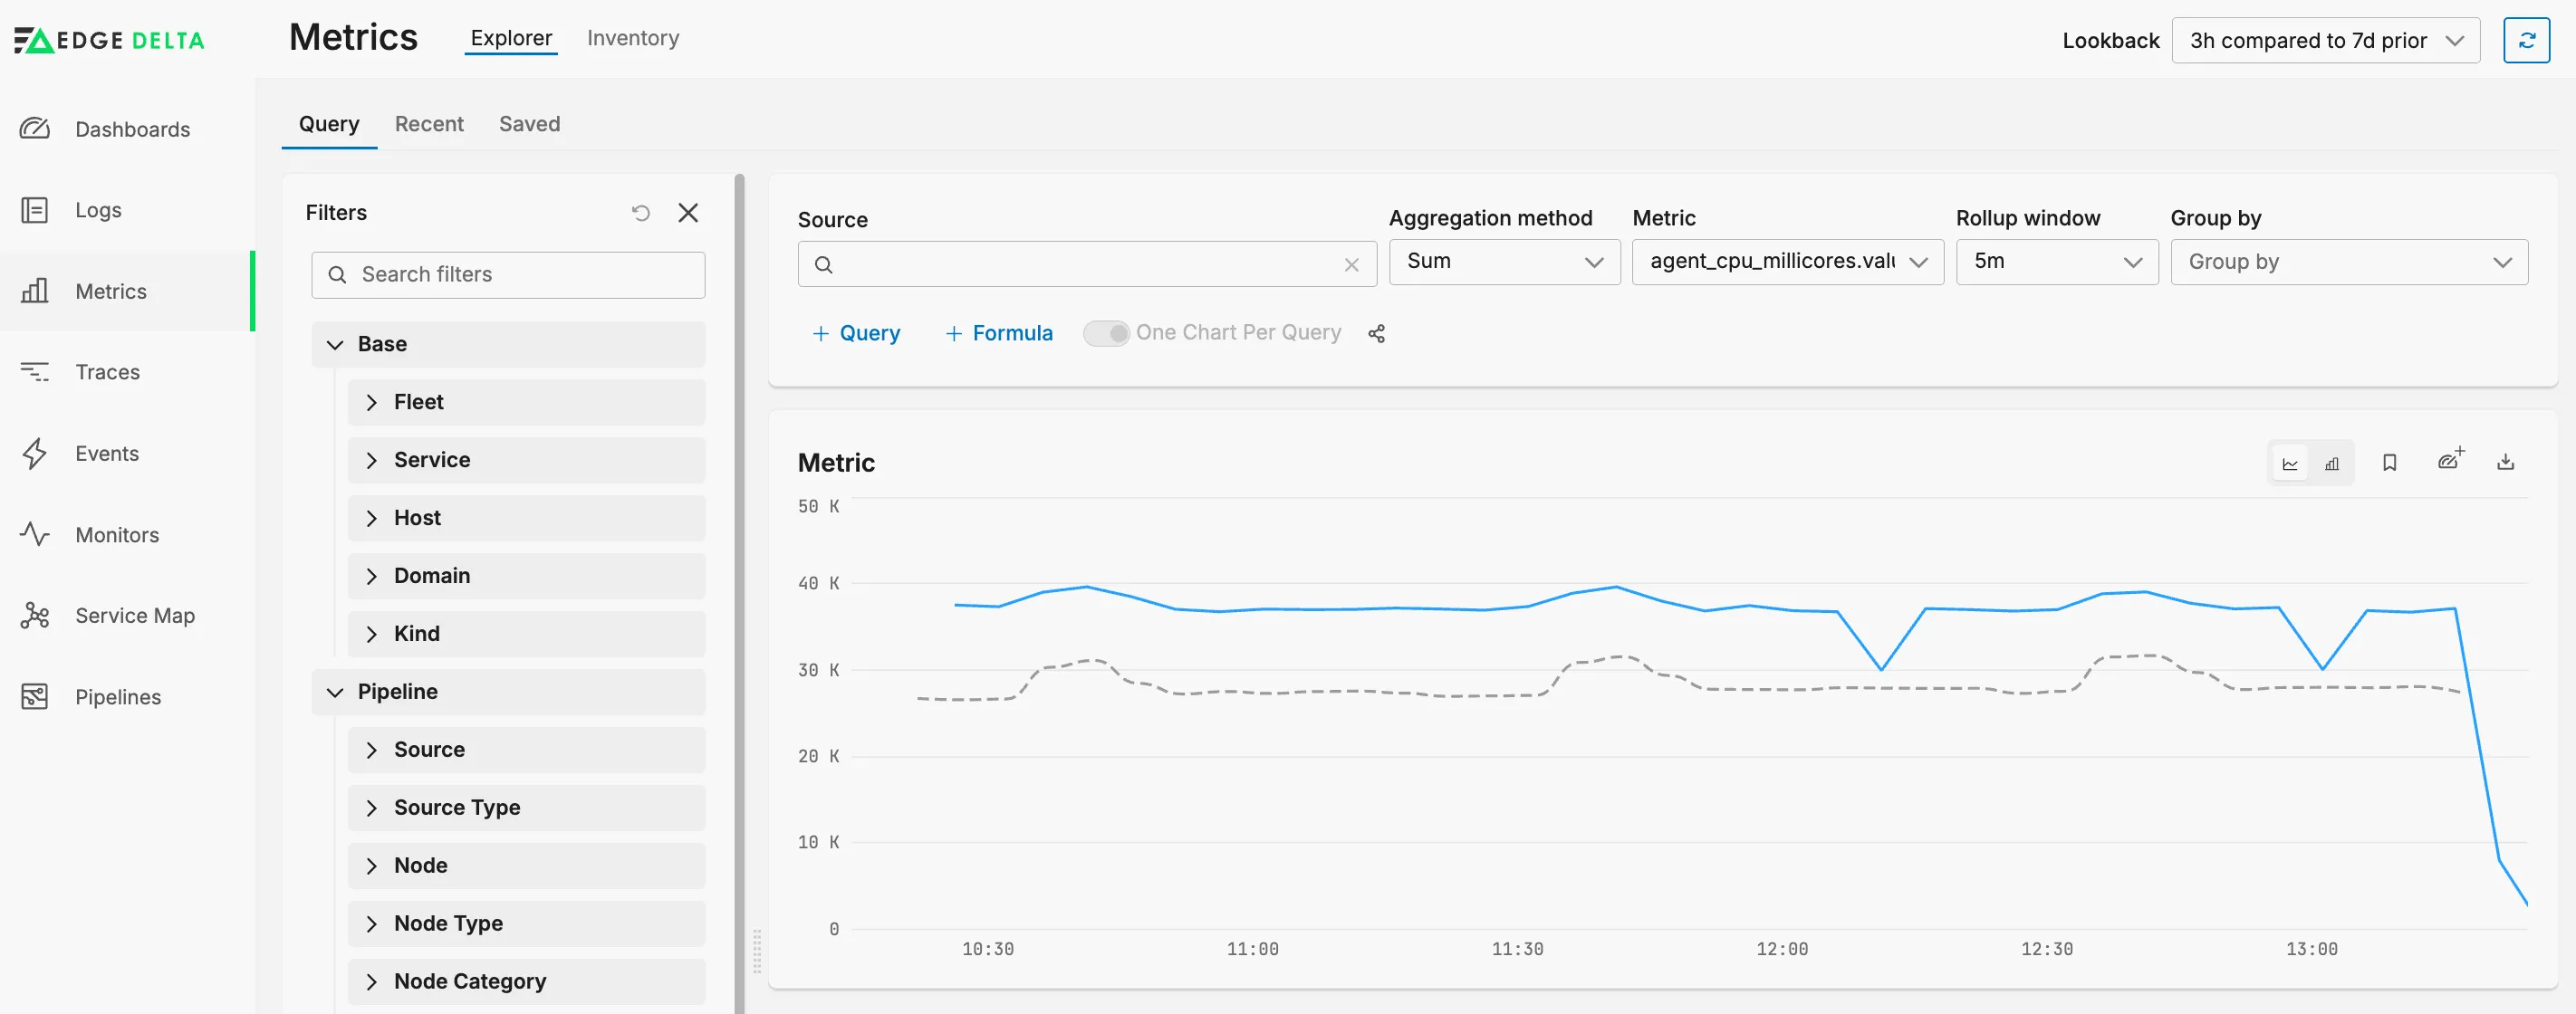
Pick a metric, filter its source, and aggregate it six ways: sum, average, min/max, count, median, count-unique. A rollup control sets the window each aggregation runs over, and its minimum scales with the lookback, so a fifteen-minute view can resolve to fifteen-second buckets where an hour-long one cannot.
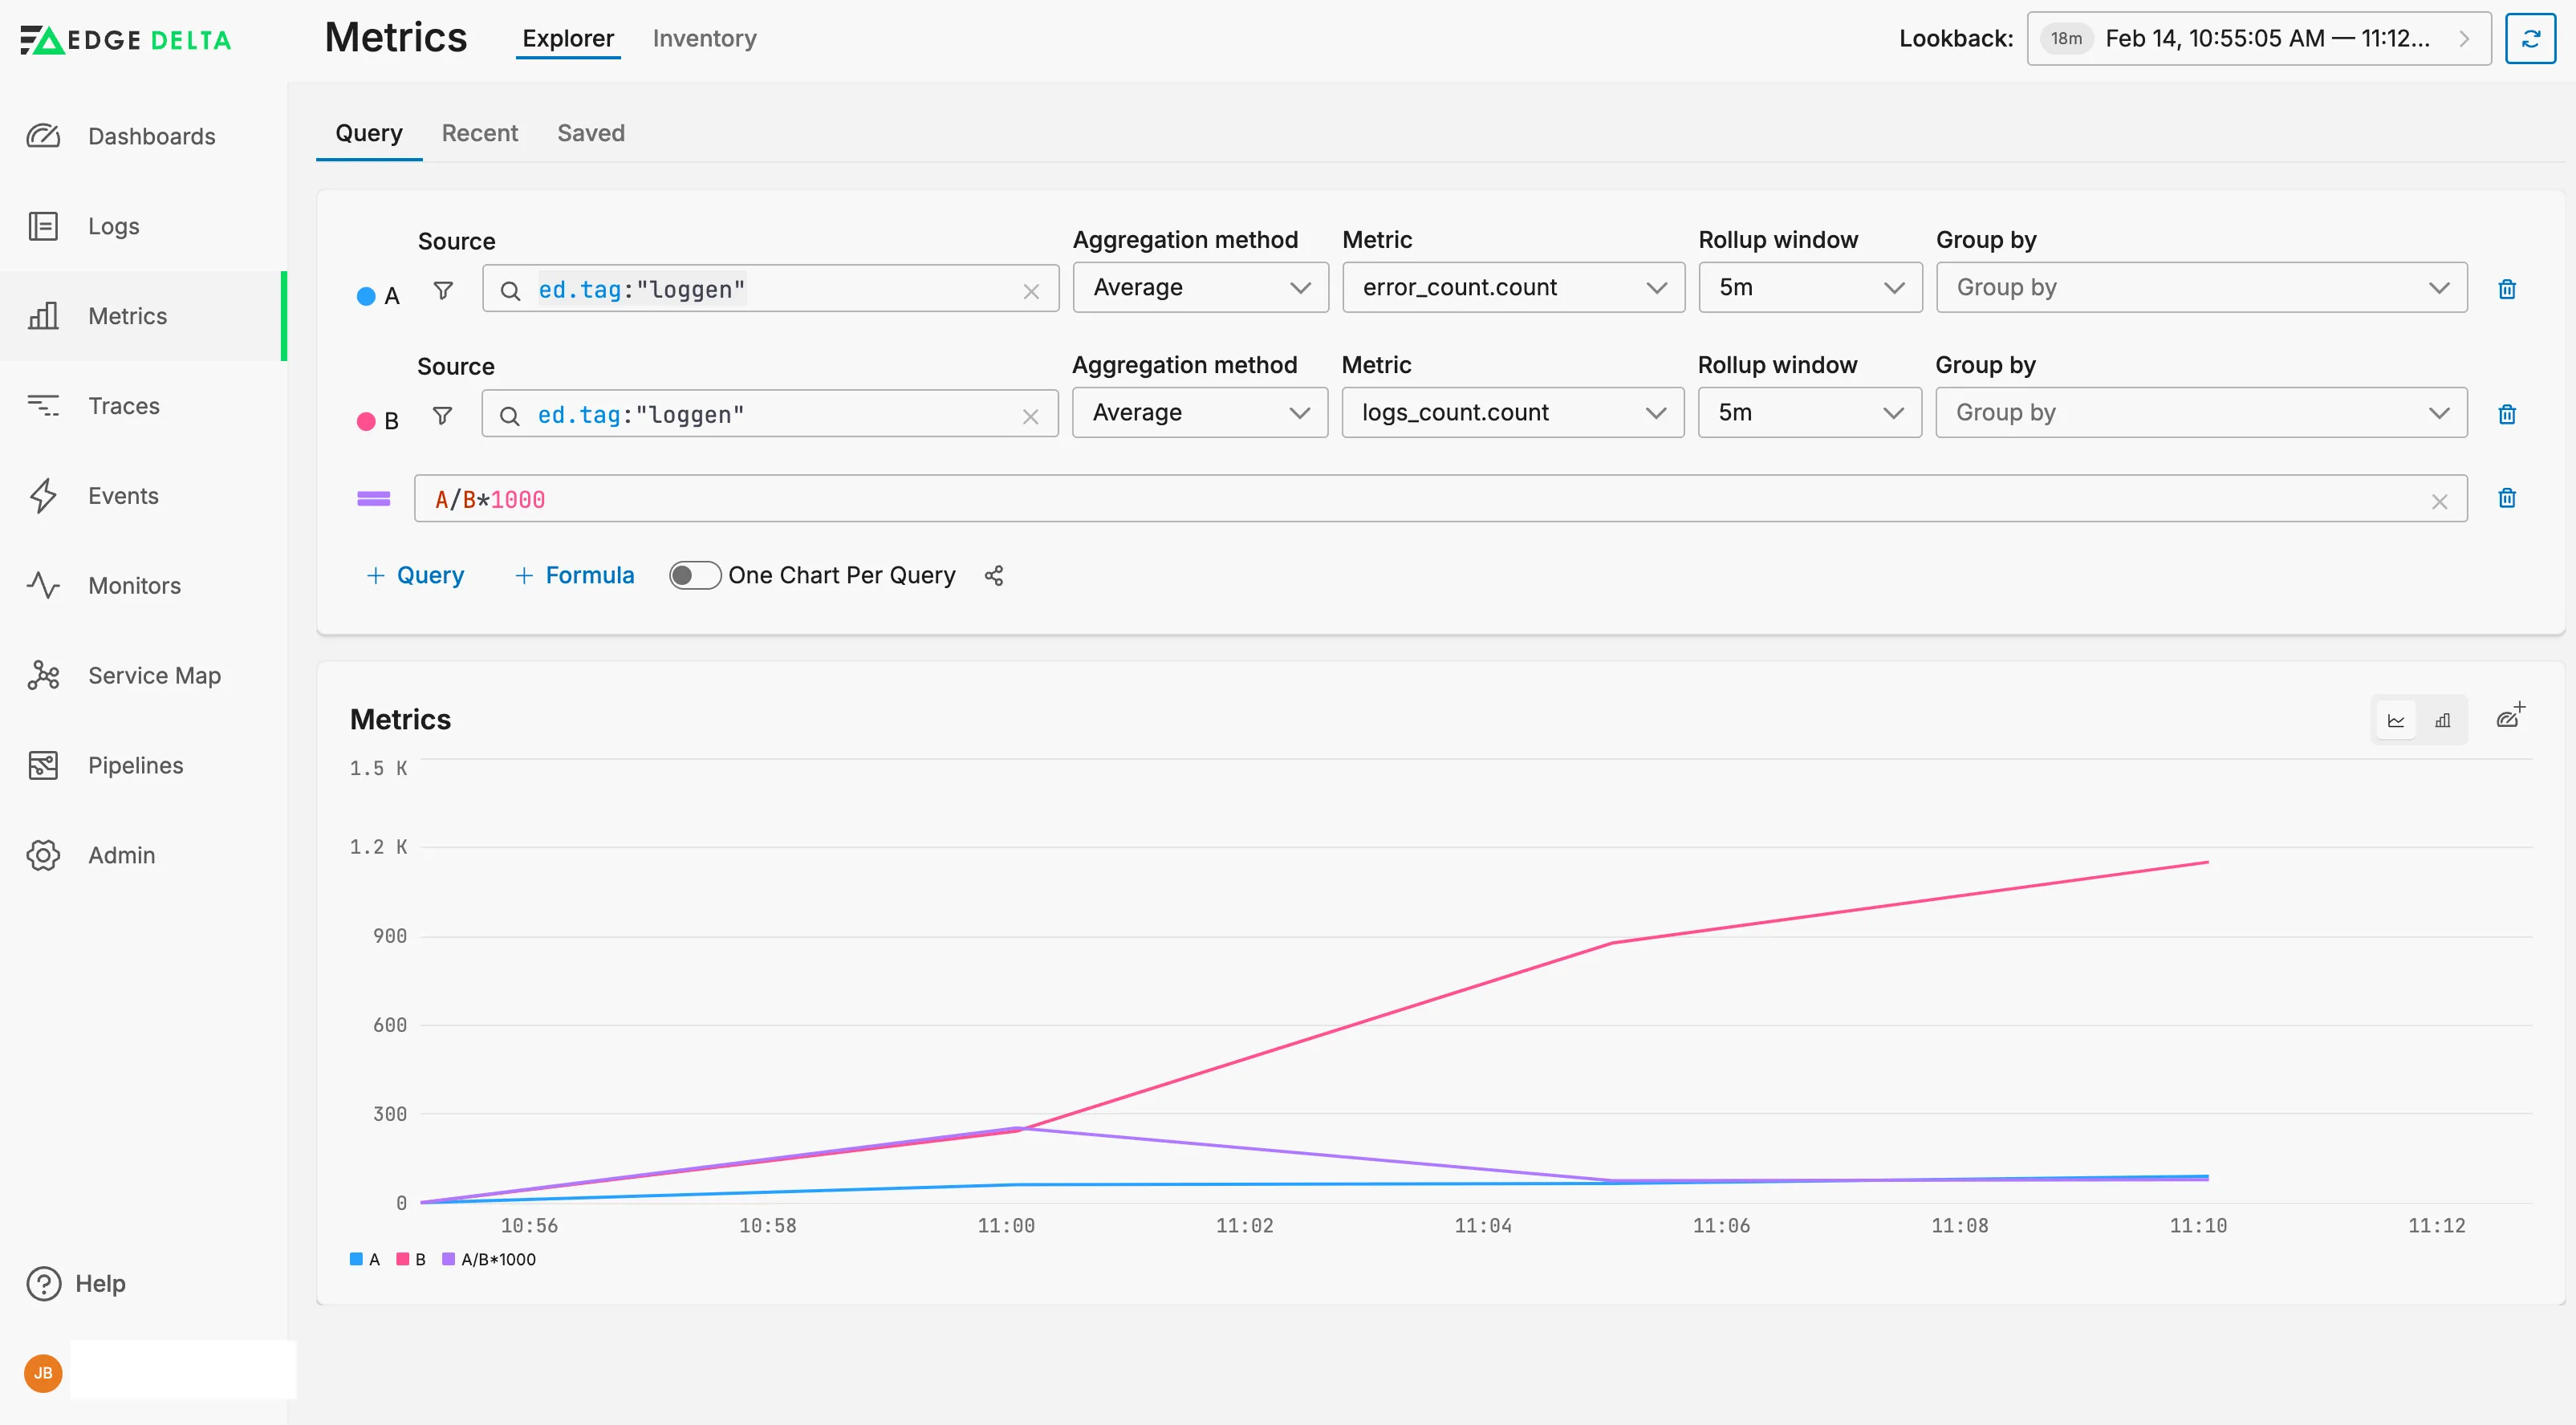
A second query can be added and a formula written across both, referring to each by letter, so ratios and error rates are expressed directly rather than precomputed upstream. Queries can share one chart or be split into their own.
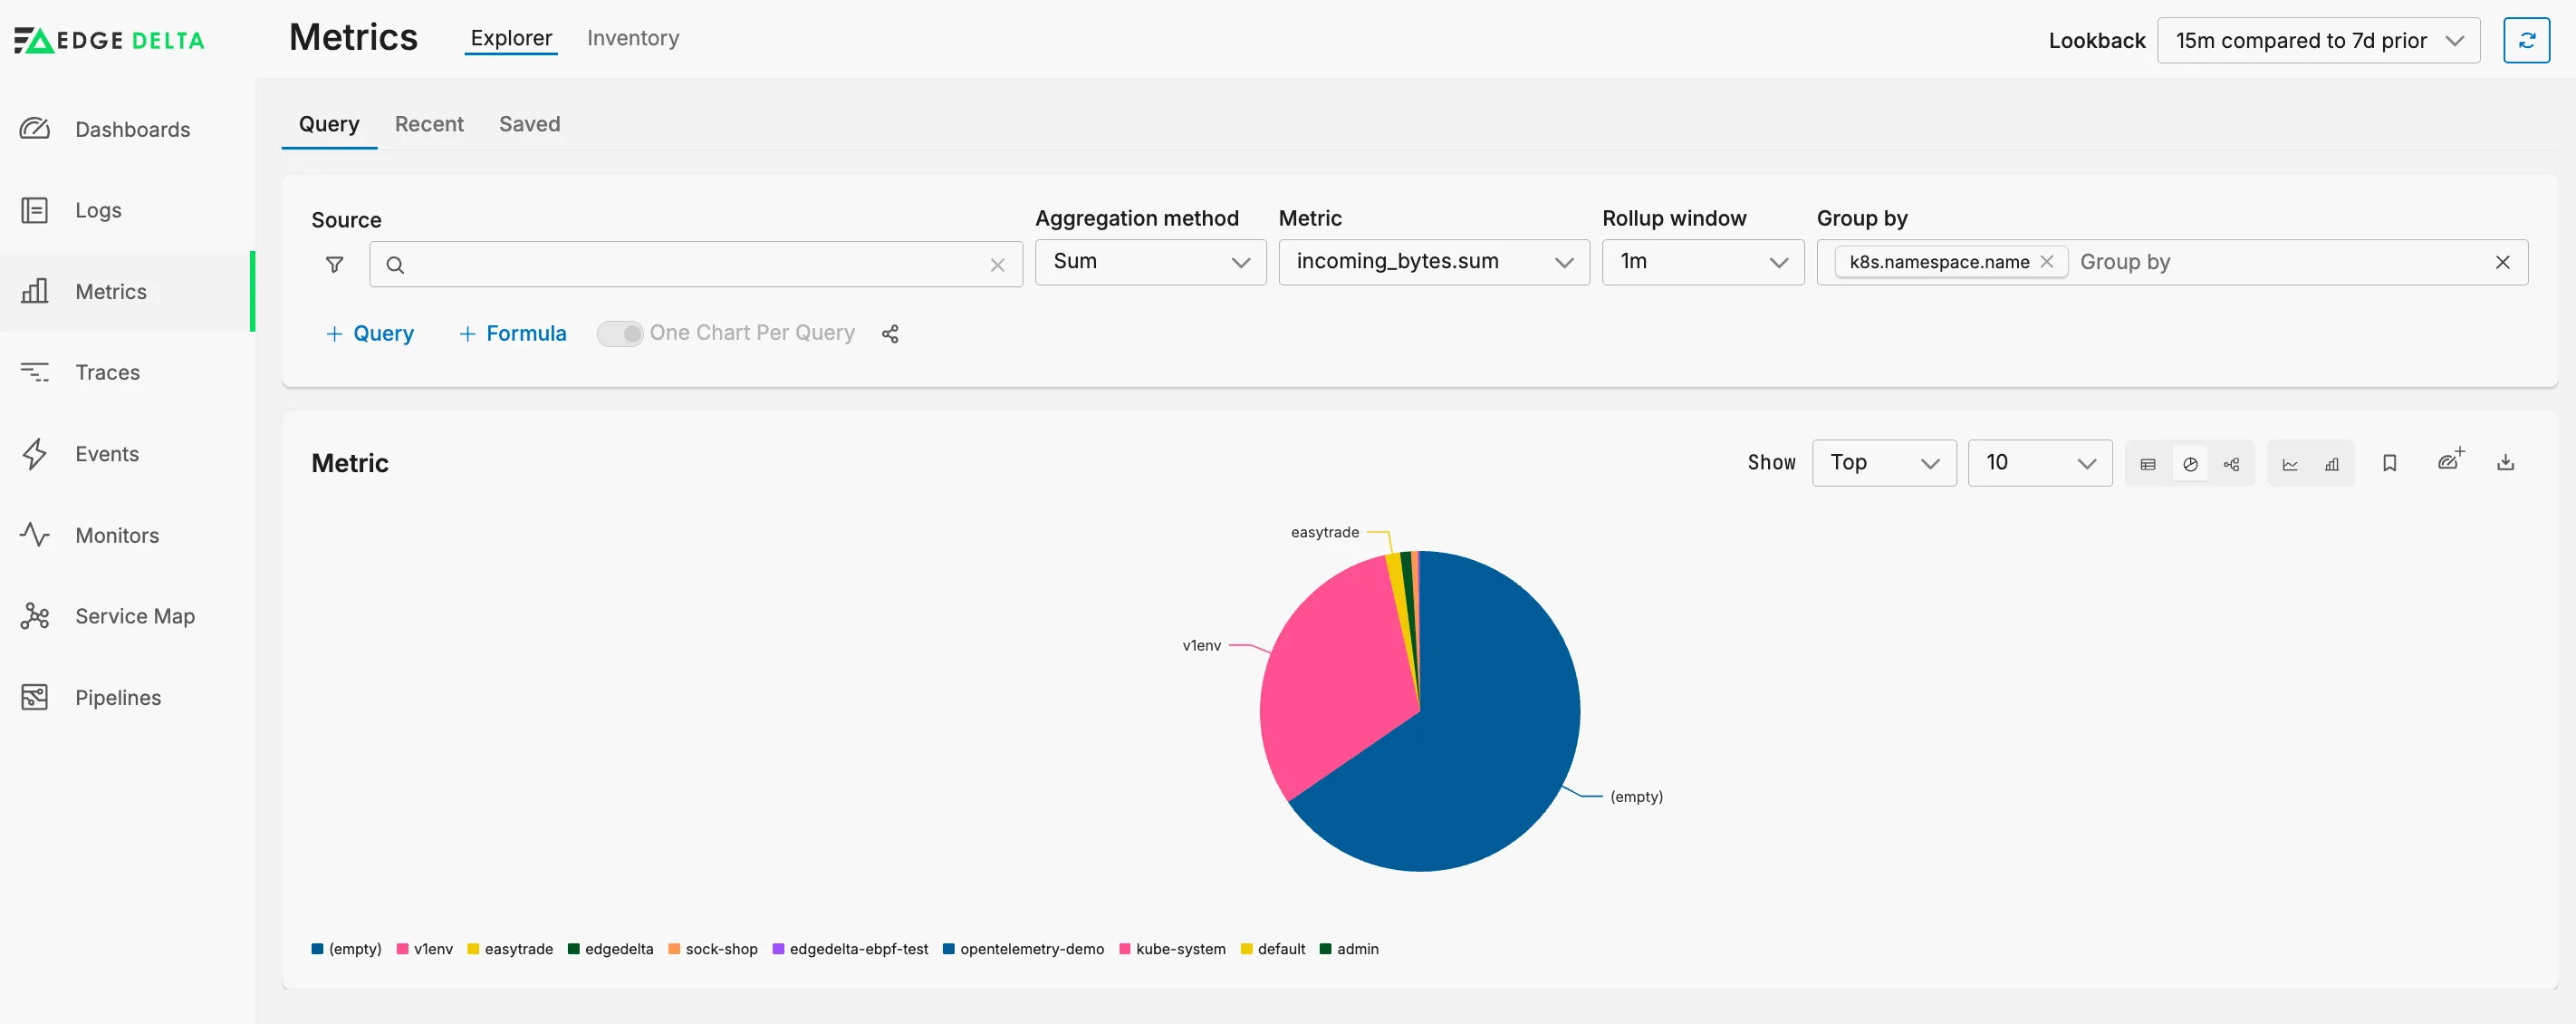
Grouping splits a series by any facet, and an arbitrary attribute can be promoted to a facet from the filter pane. Once a query is grouped, the same data is also available as a distribution rather than a set of lines.
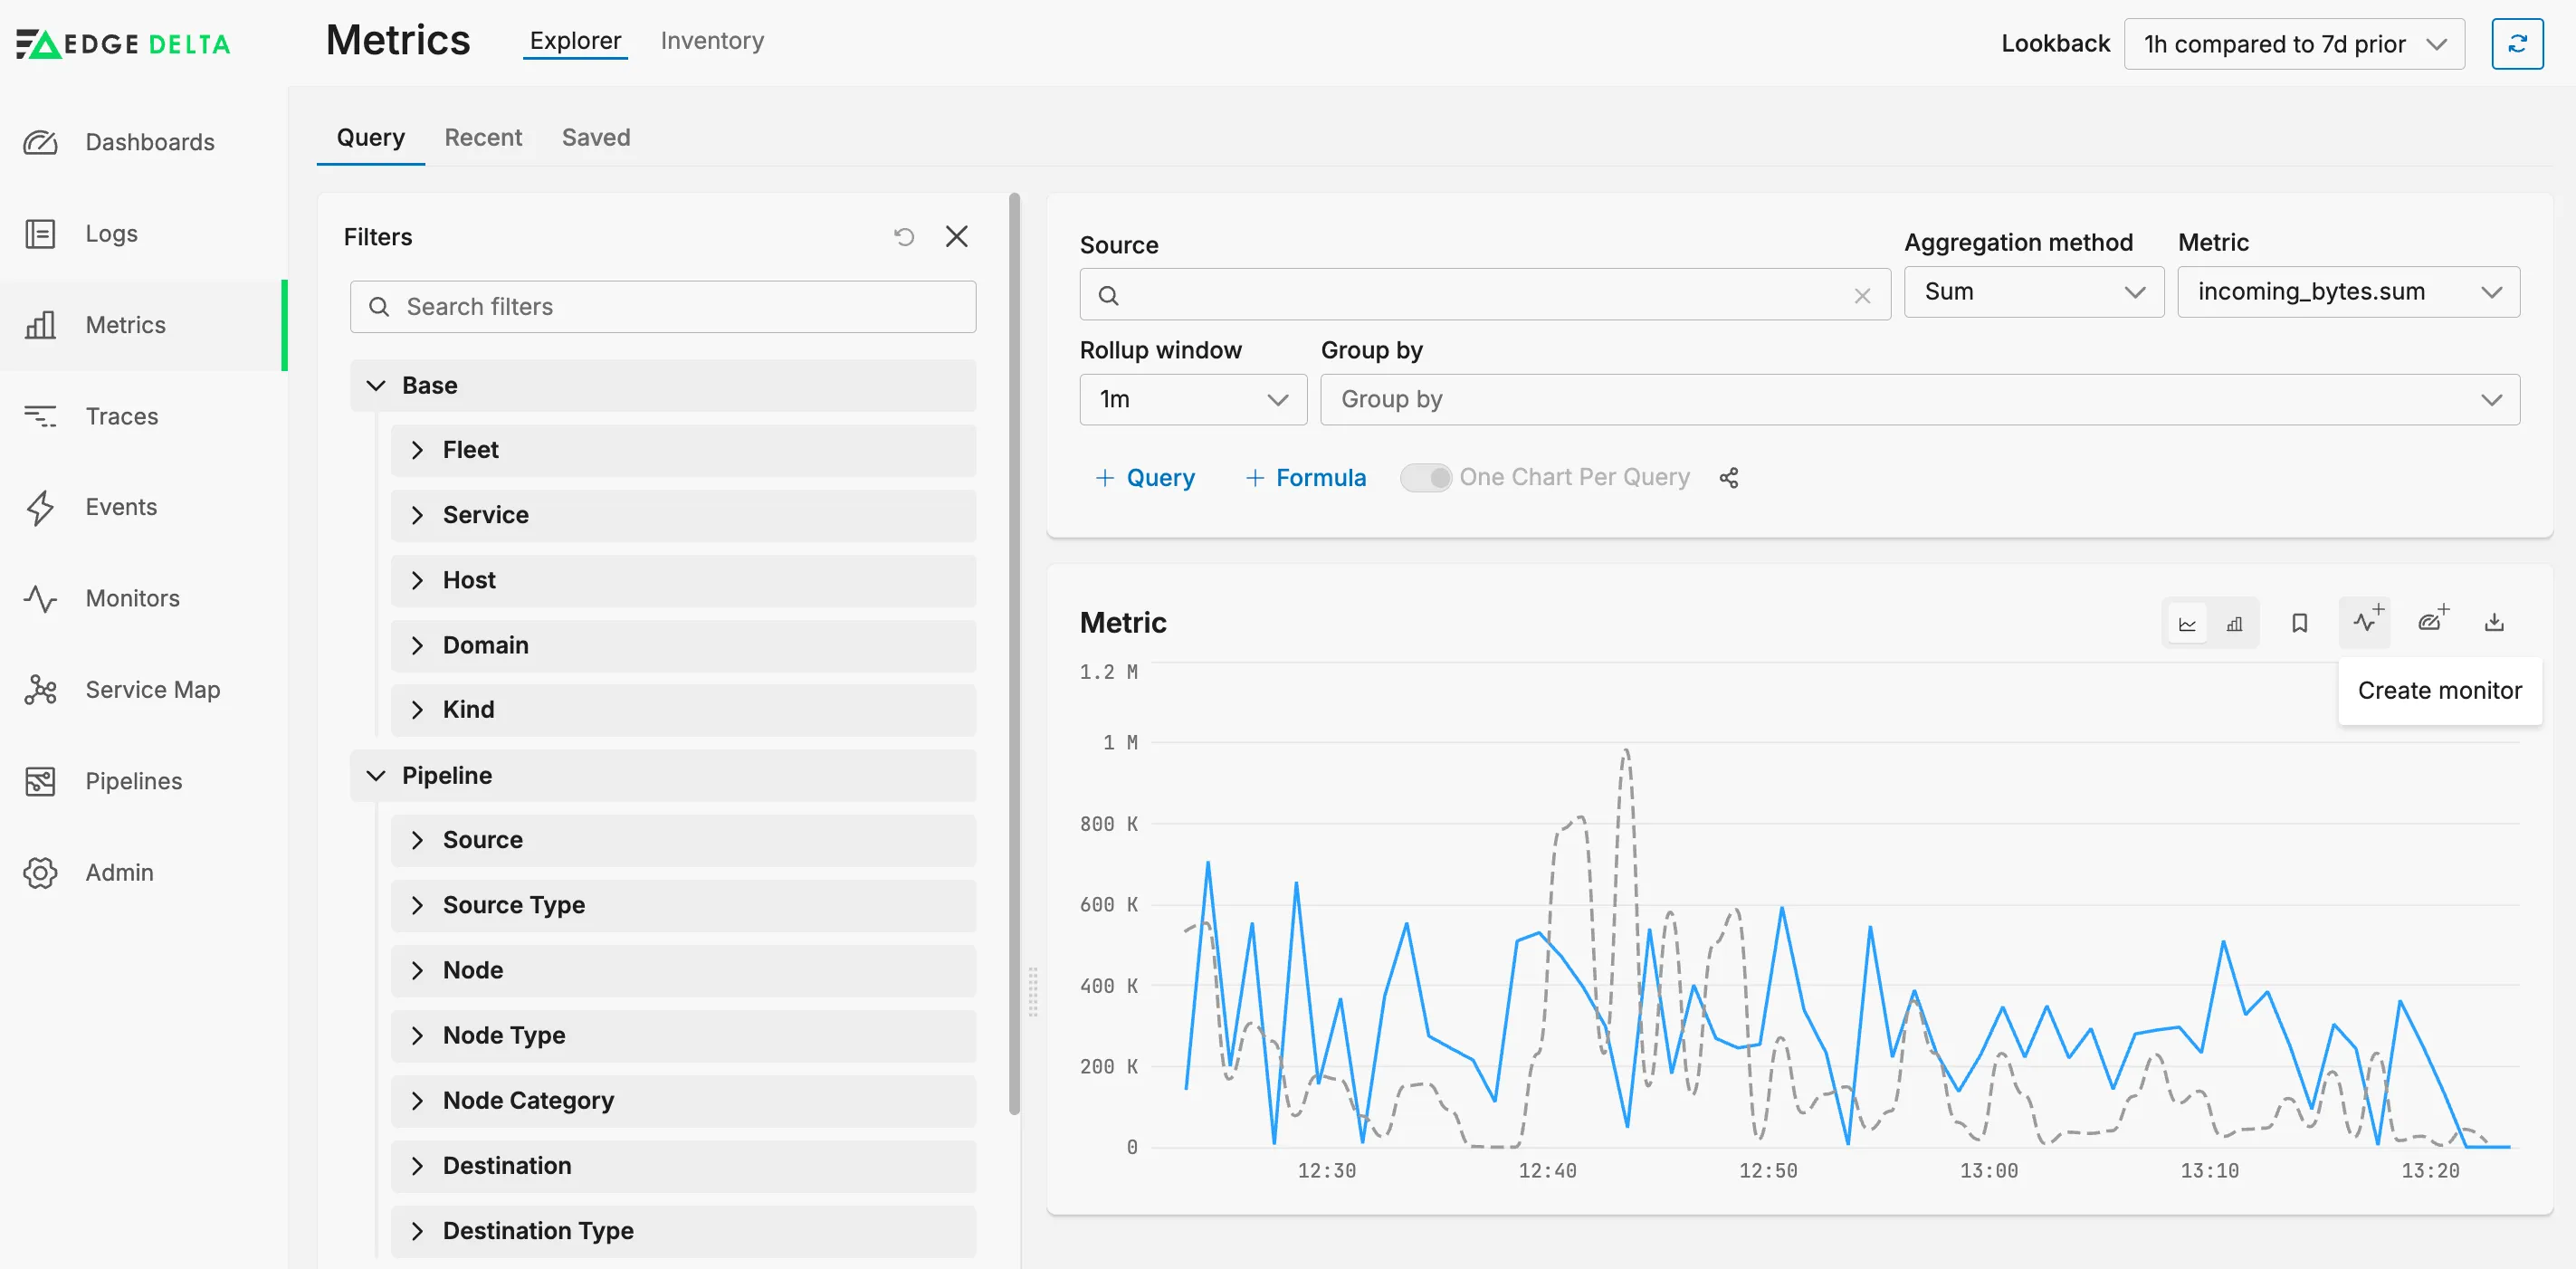
The seam that mattered most: any filter state converts to a monitor in one step, carrying its query across. It is the reason the same facets appear in the explorer, the inventory and the monitor builder.
Formulas, everywhere the same
Formulas started here and had to mean the same thing in three other places: dashboards, threshold monitors and metric-change monitors. Alongside the arithmetic are operators comparing a series to itself, timeshift for the same window a day or a week ago, moving_average for smoothing, and fill so a gap reads as a gap rather than a zero.
Formula validation rejects invalid expressions when they are saved to a monitor, preventing an incorrect query from driving an alert.