Service Map
A live node-link graph of service-to-service traffic, drawn from kernel-level observation rather than instrumentation, with error rate and latency encoded on the graph itself.
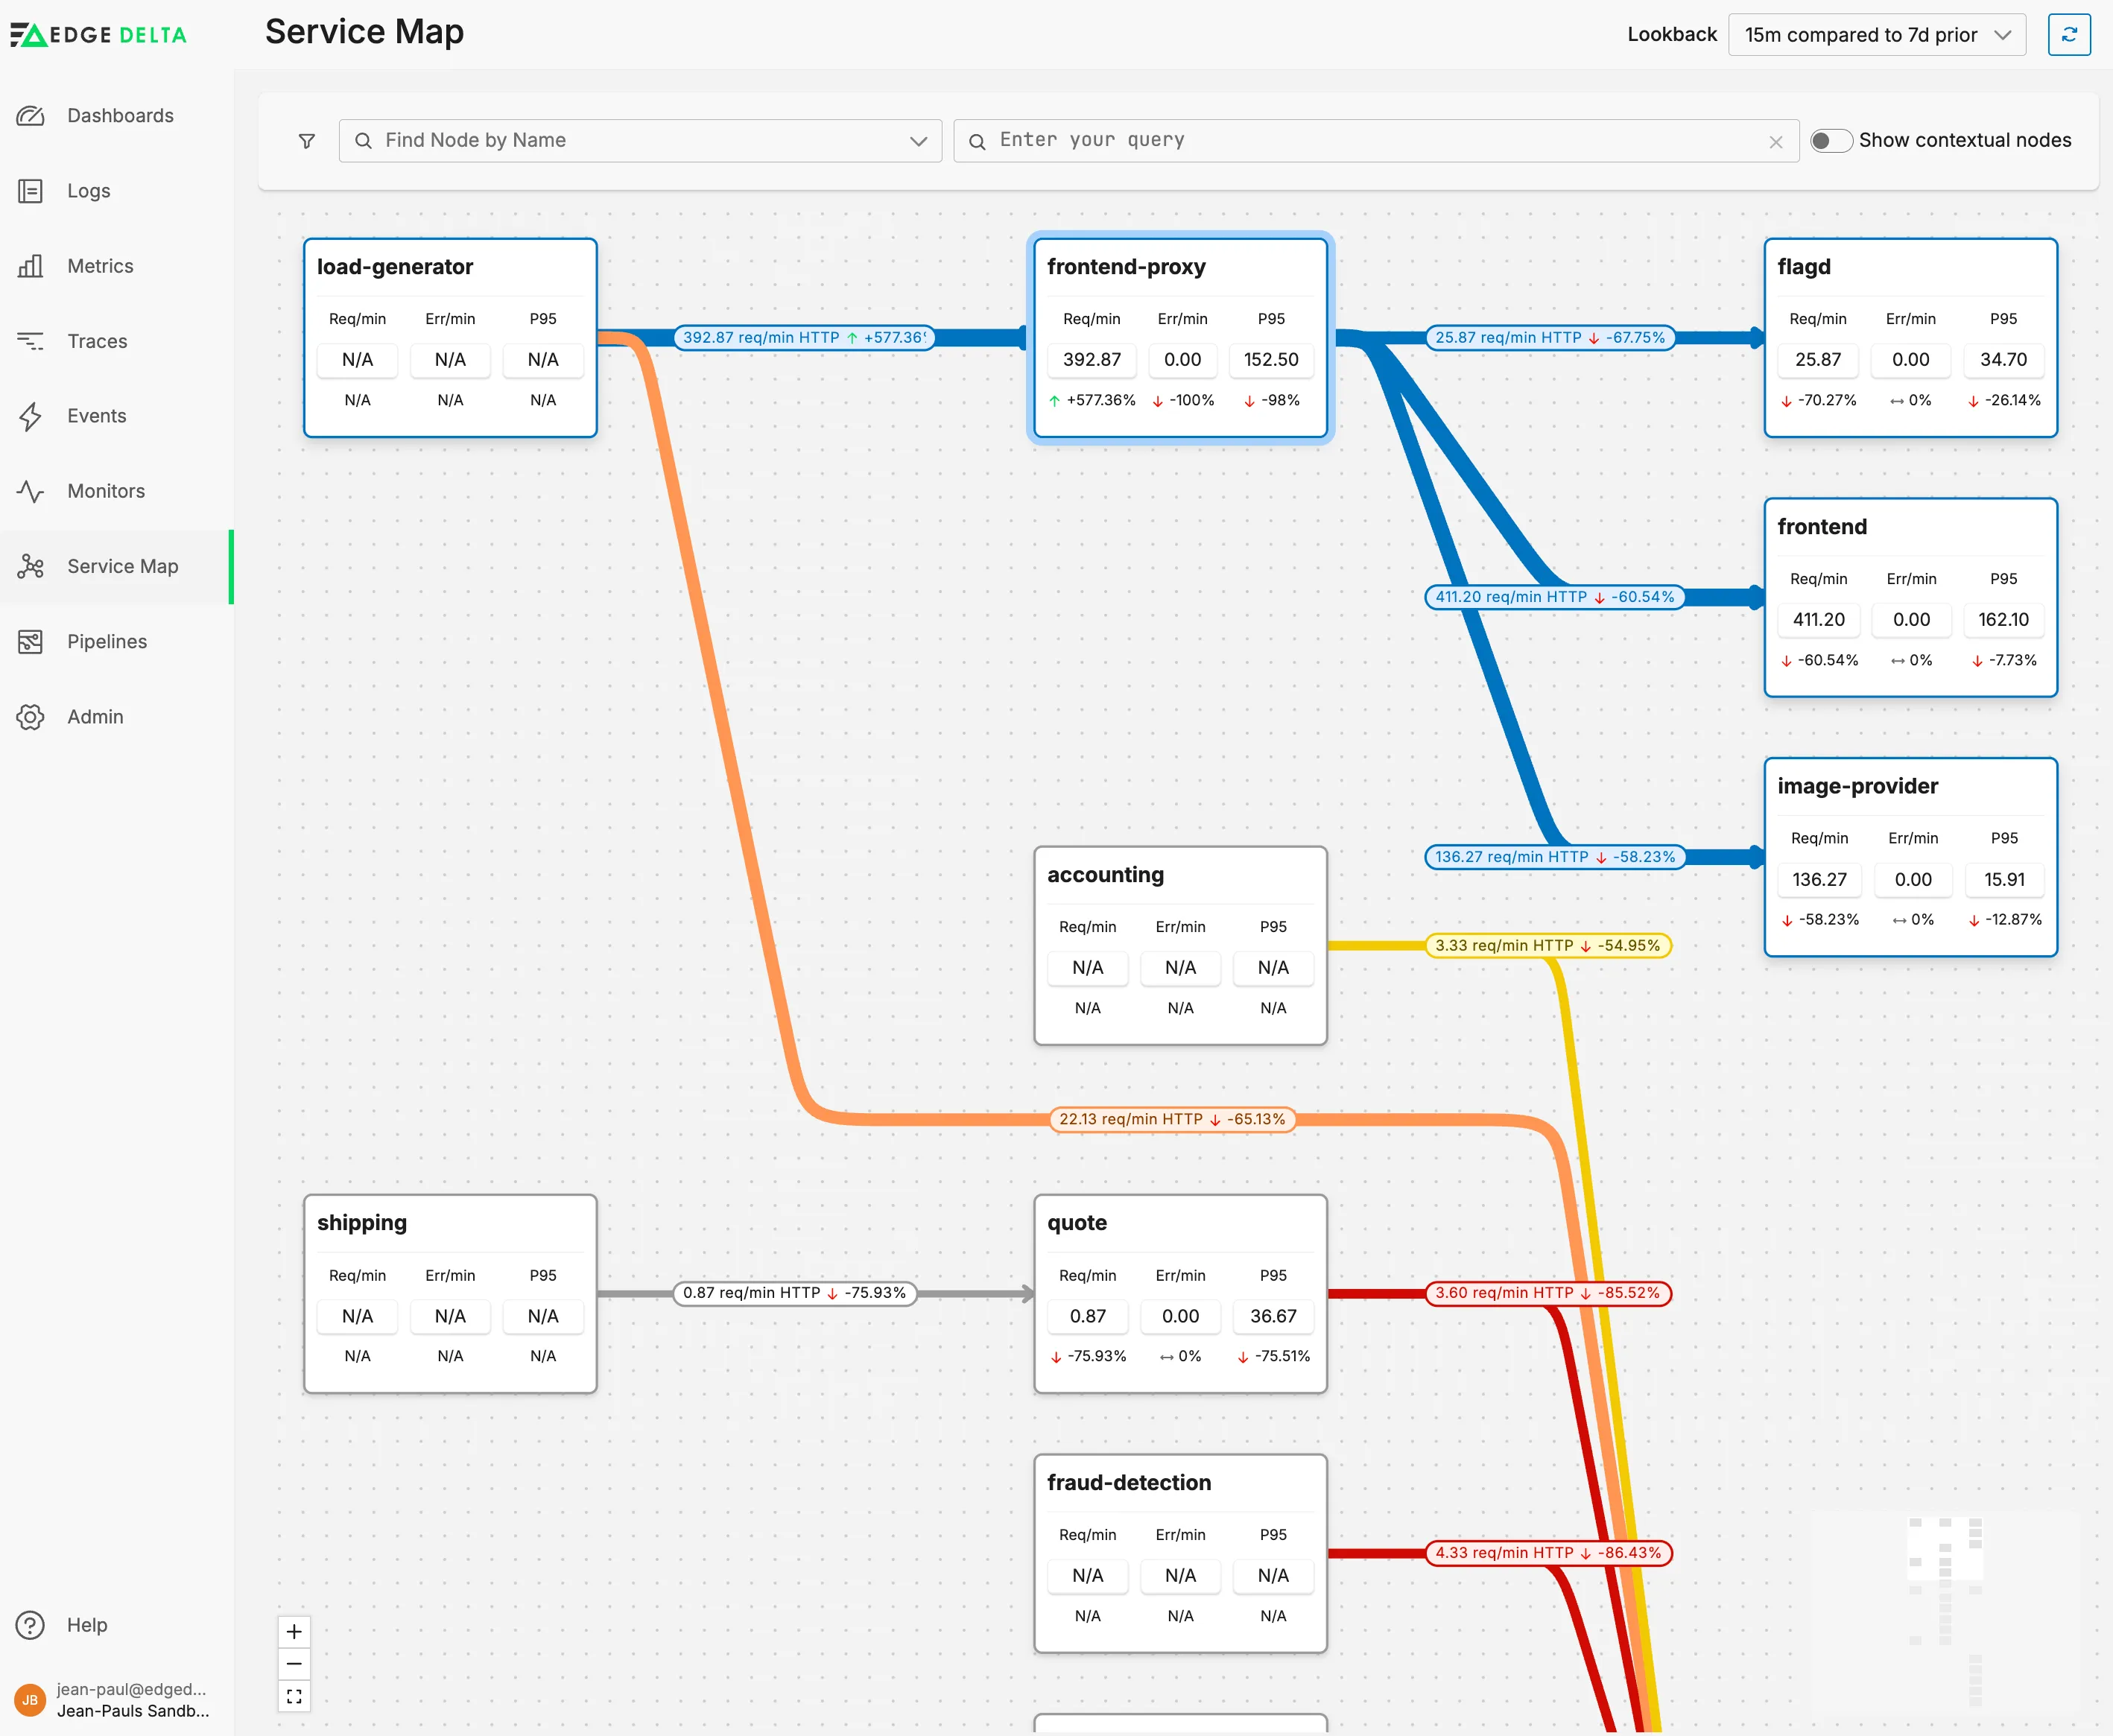
The agent observes traffic with eBPF, so the topology needs no sidecars, no code changes and no service mesh. Nodes carry requests per minute, errors per minute and P95 latency, and take their colour from error rate: yellow below ten percent, orange to twenty, red above. Edge thickness carries volume.
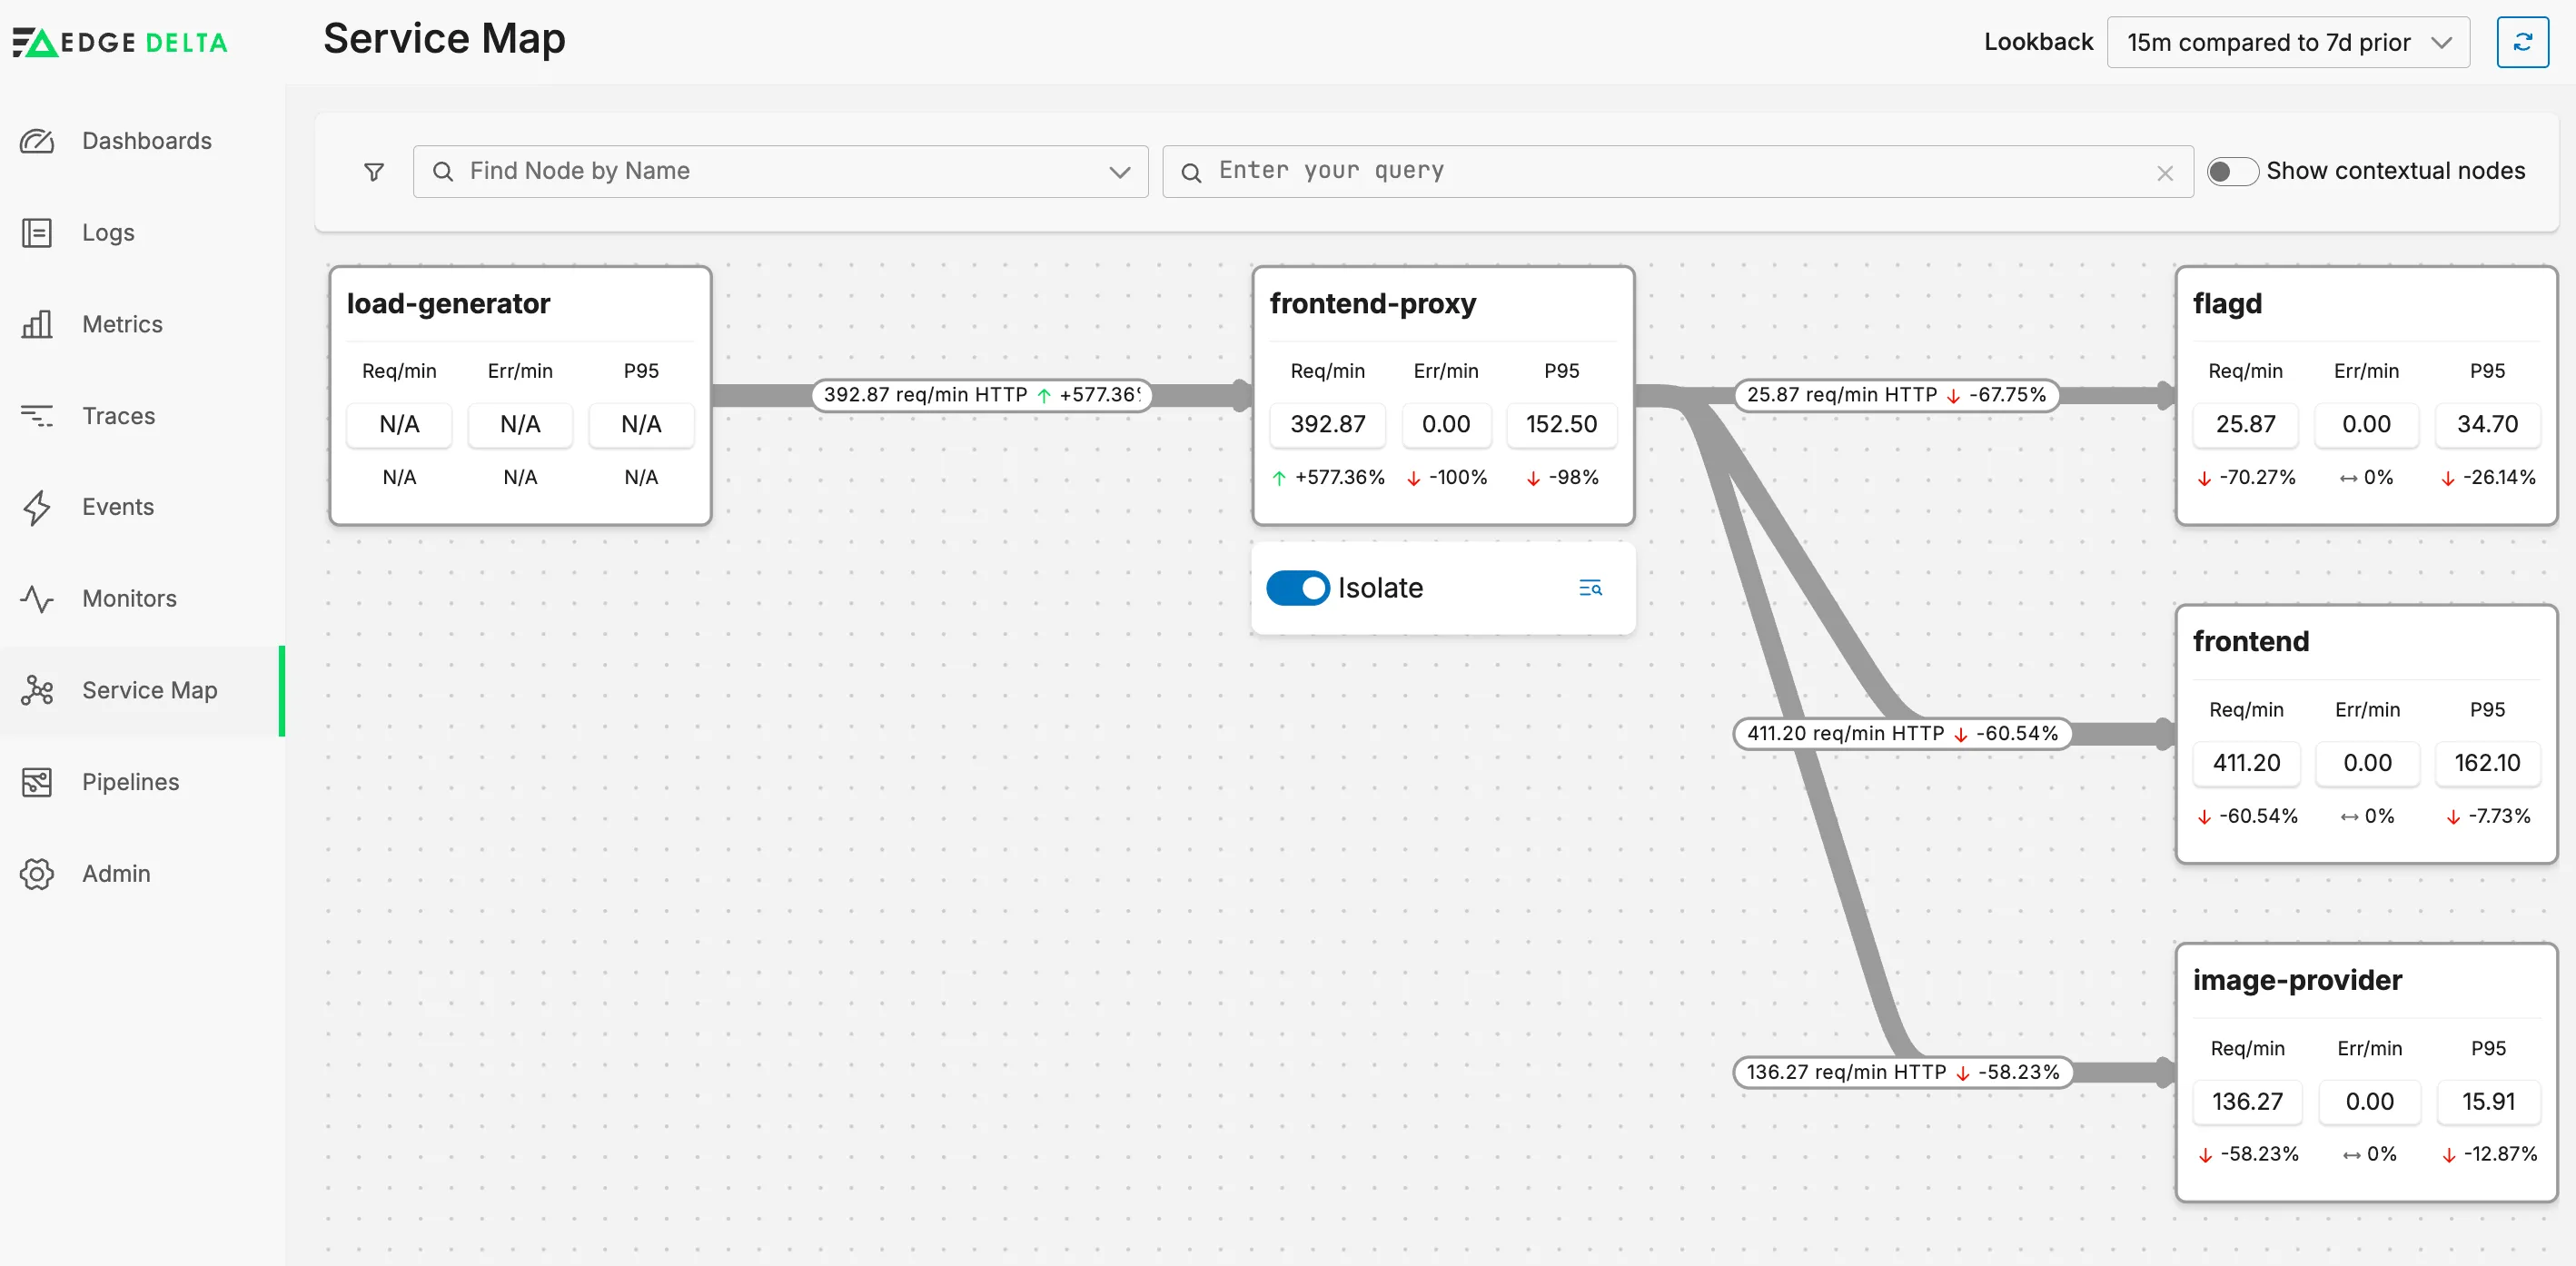
On a real map the interesting part is rarely the whole map. Isolating a service collapses the graph to that node and its immediate neighbours, which is the difference between a diagram and something you can work in during an incident.
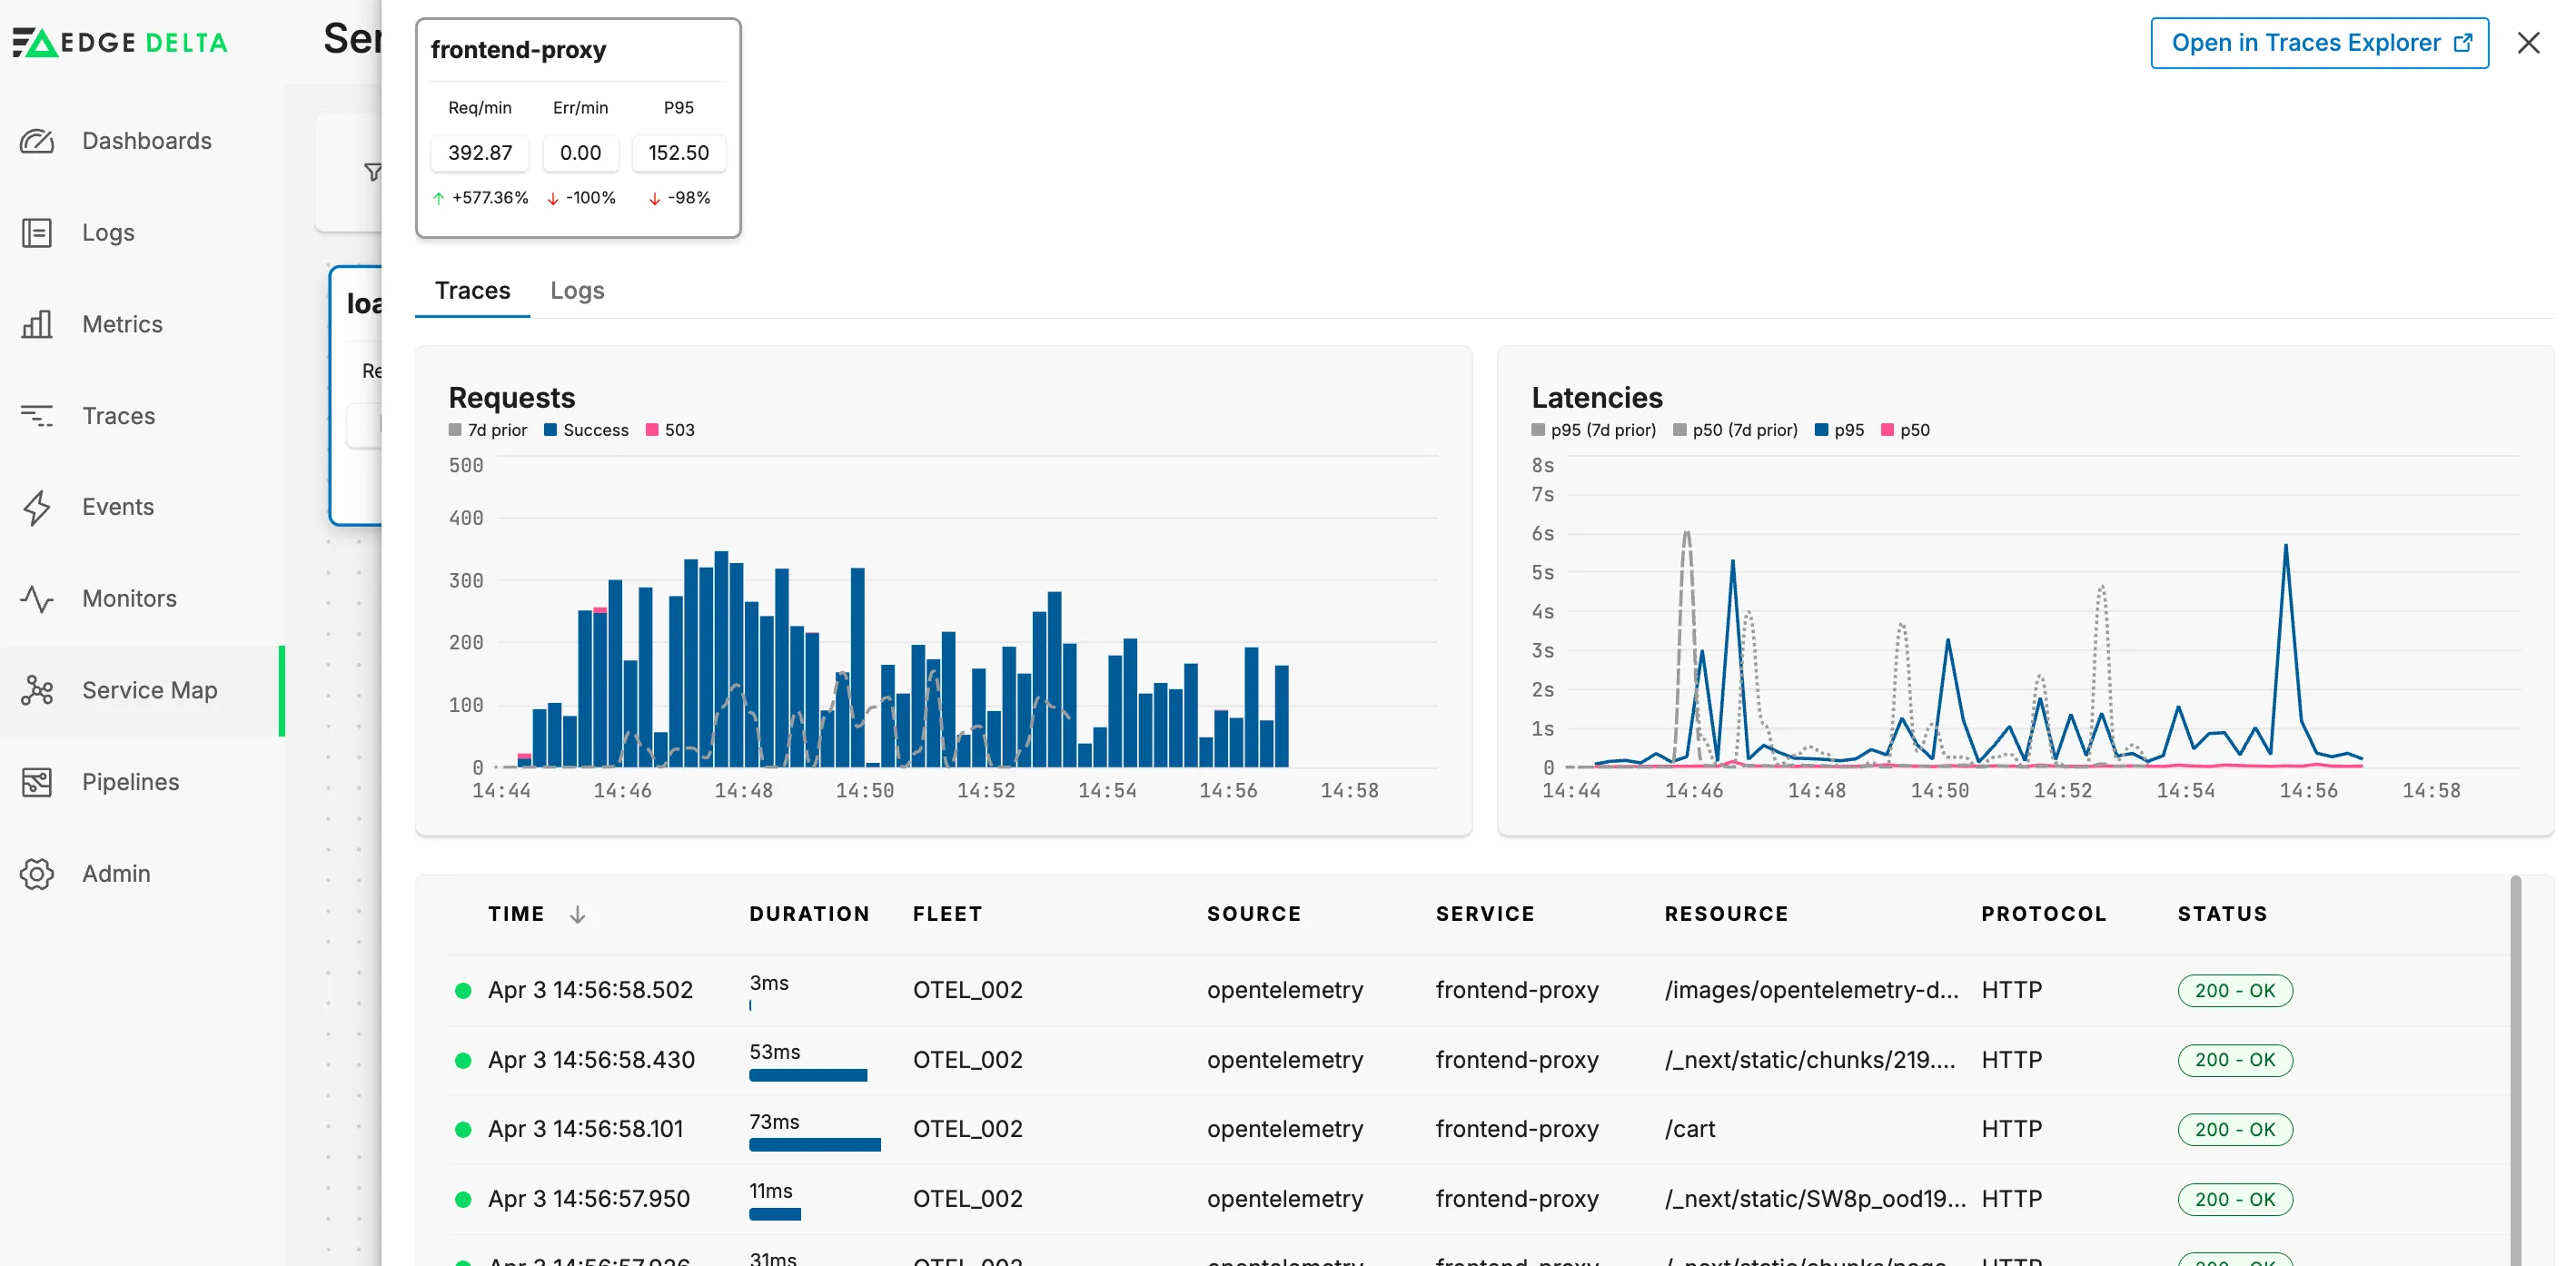
Opening a service gives its traces, request and latency charts, and the logs from the same window, so the question a graph raises can be answered without leaving it.
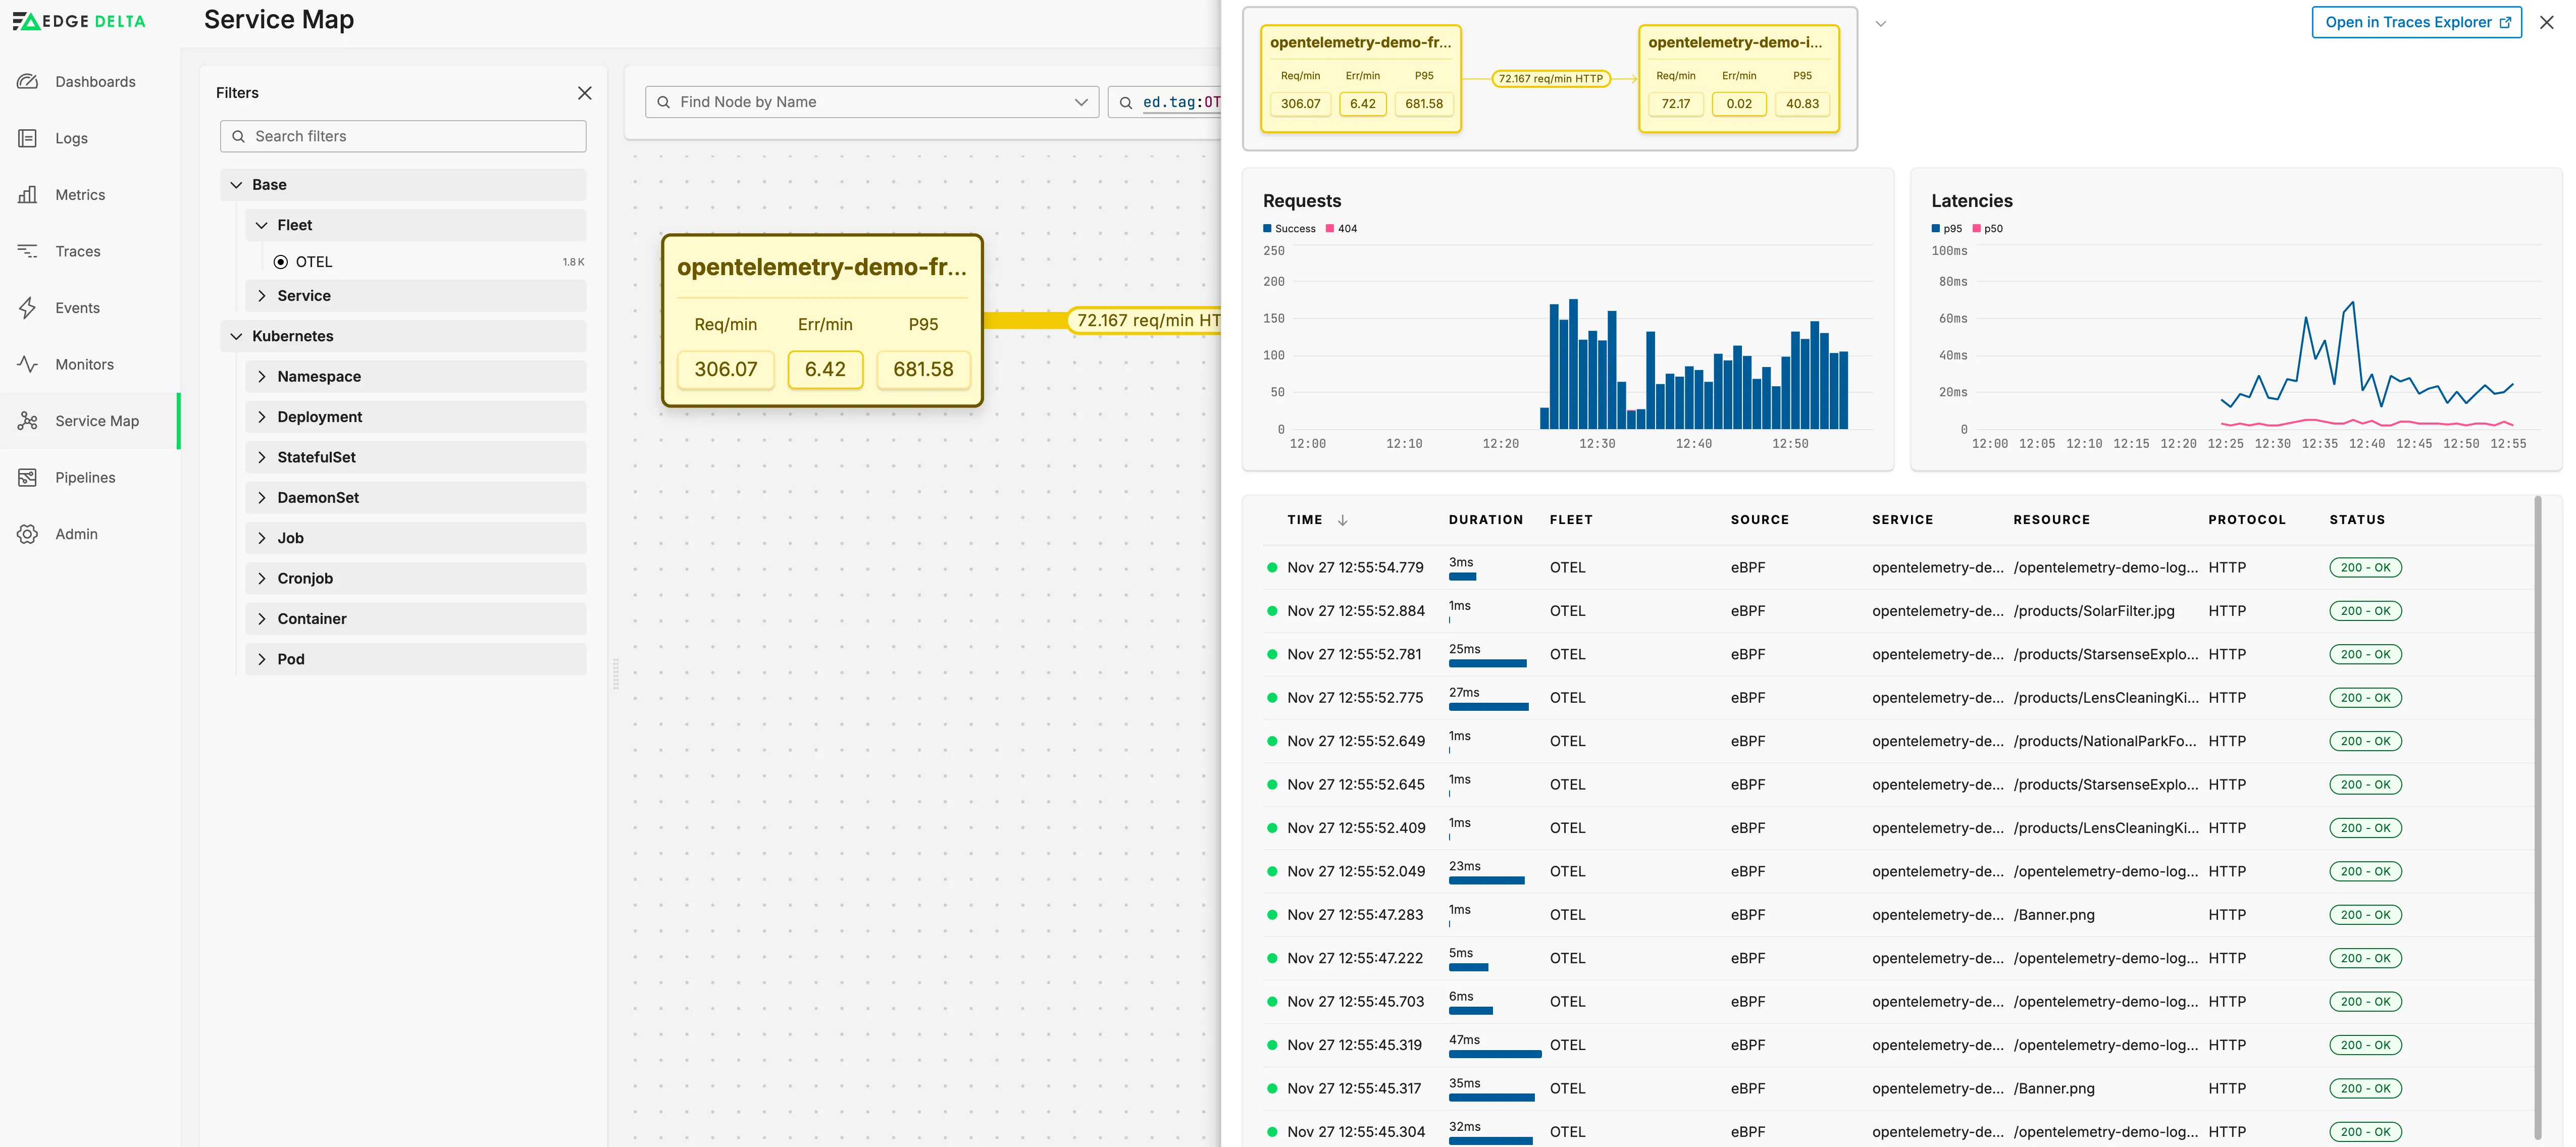
Edges are selectable in their own right. A connection resolves to its source and destination, the metrics for that pair alone, and the traces crossing it.
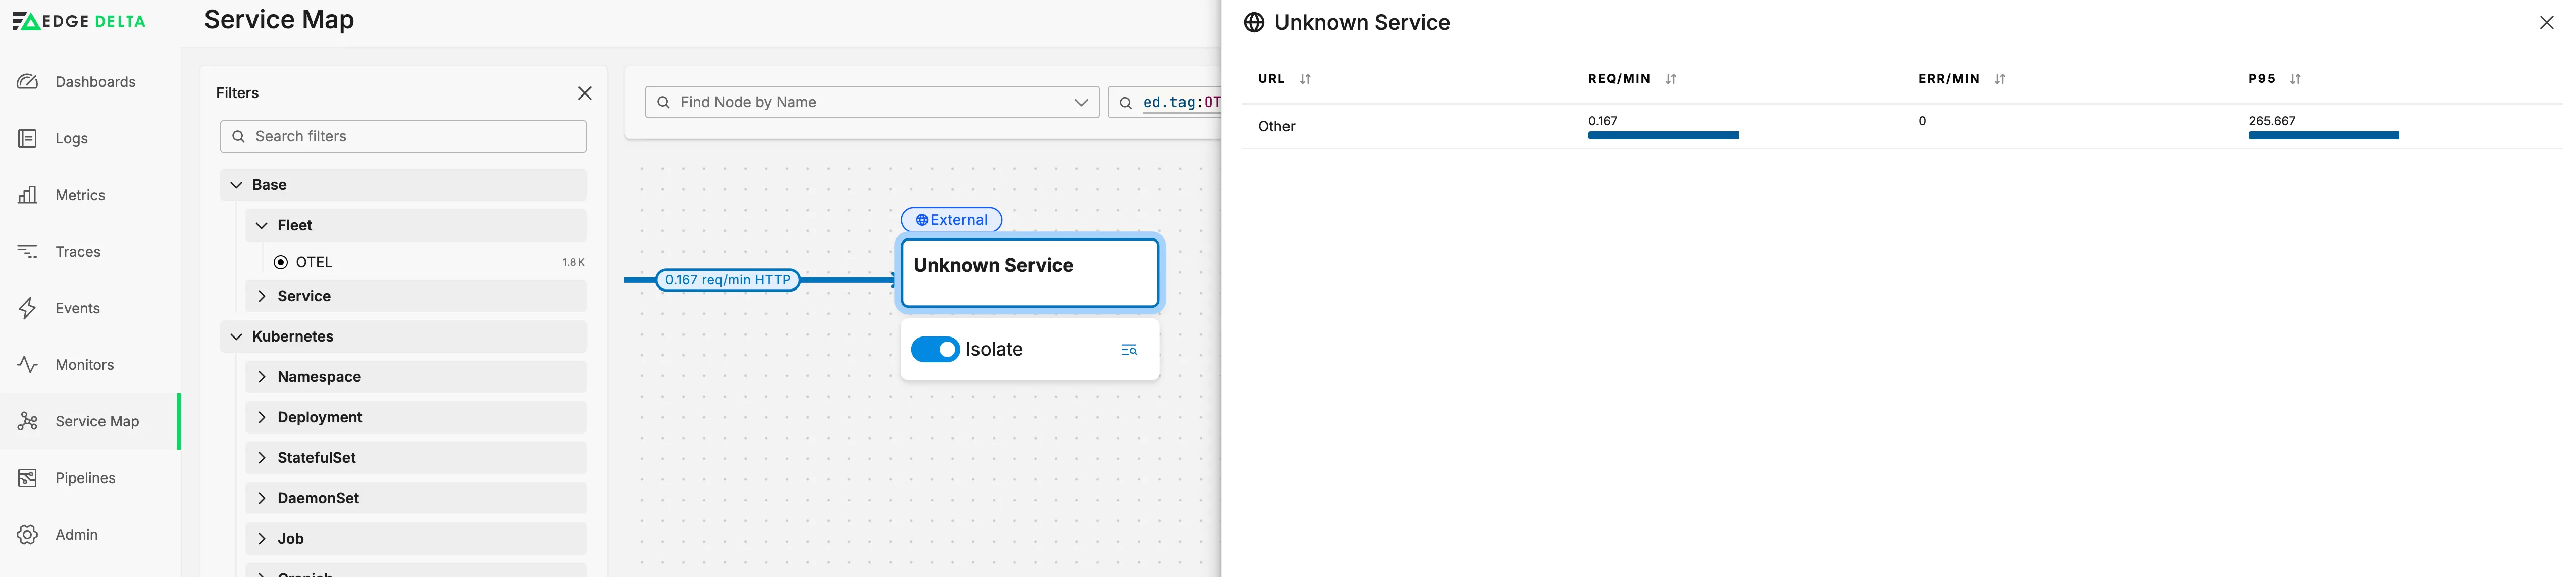
Traffic that will not resolve to a known service still has to appear somewhere, or the map quietly lies about the edges of the system. It is collected into an explicit unknown-service node instead of being dropped.