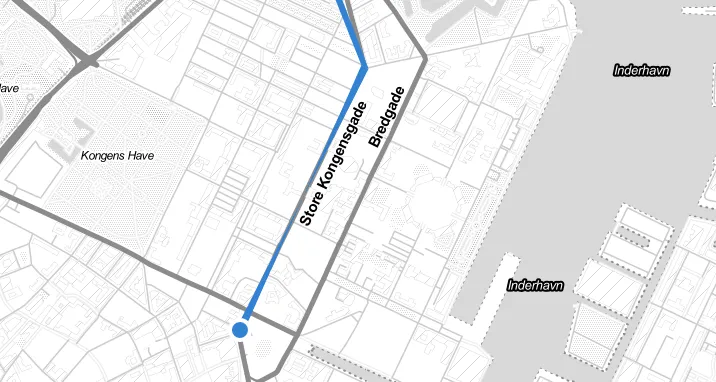
Bike Maps
data visualisation, maps
A visualisation of bicycle traffic along a Copenhagen commuter corridor, built to find the factual basis for a green wave: traffic lights timed so cyclists meet as few red lights as possible.
The City of Copenhagen tagged around 300 randomly chosen bicycles with passive RFID tags, which leave a trace each time they pass one of 5 RFID antennas. The study ran for 6 months, sampled hourly, and collected no personal data.
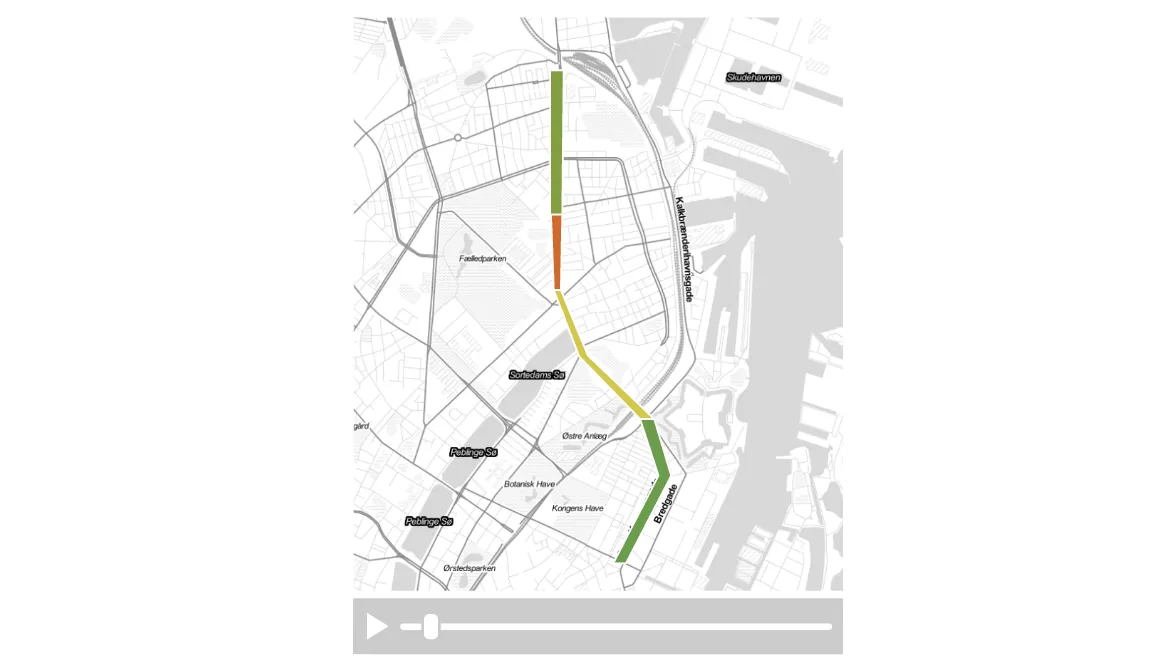
The corridor runs from Østerbro past Fælledparken and the lakes to Bredgade, with each segment colored by traffic, played back over the study period.
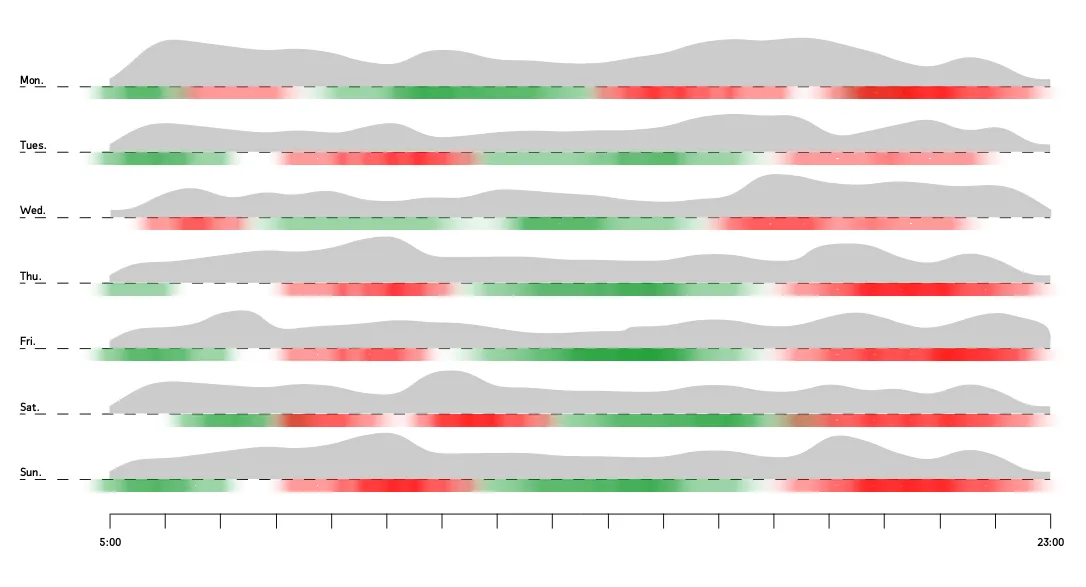
One row per weekday, 5:00 to 23:00: the grey profile is traffic volume, with a band beneath it shading each stretch of the day from green to red. Patterns and seasonal variation show up here first.
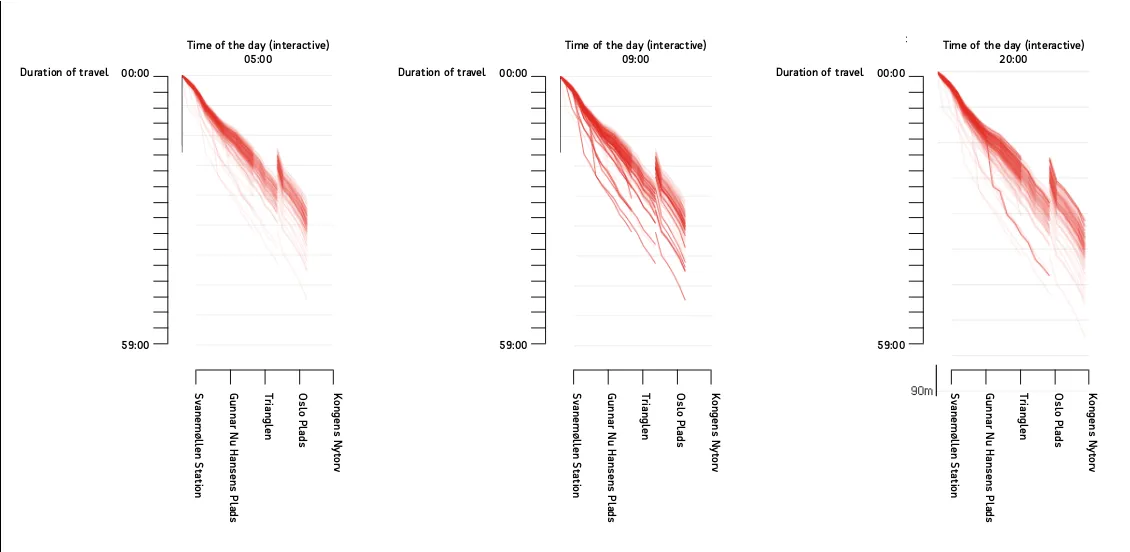
Travel time between the antennas at Svanemøllen Station, Gunnar Nu Hansens Plads, Trianglen, Oslo Plads and Kongens Nytorv, one line per trip, at 5:00, 9:00 and 20:00. Where the lines steepen and fan out is where riders wait at intersections.