Wind Power In Denmark 1977-2020
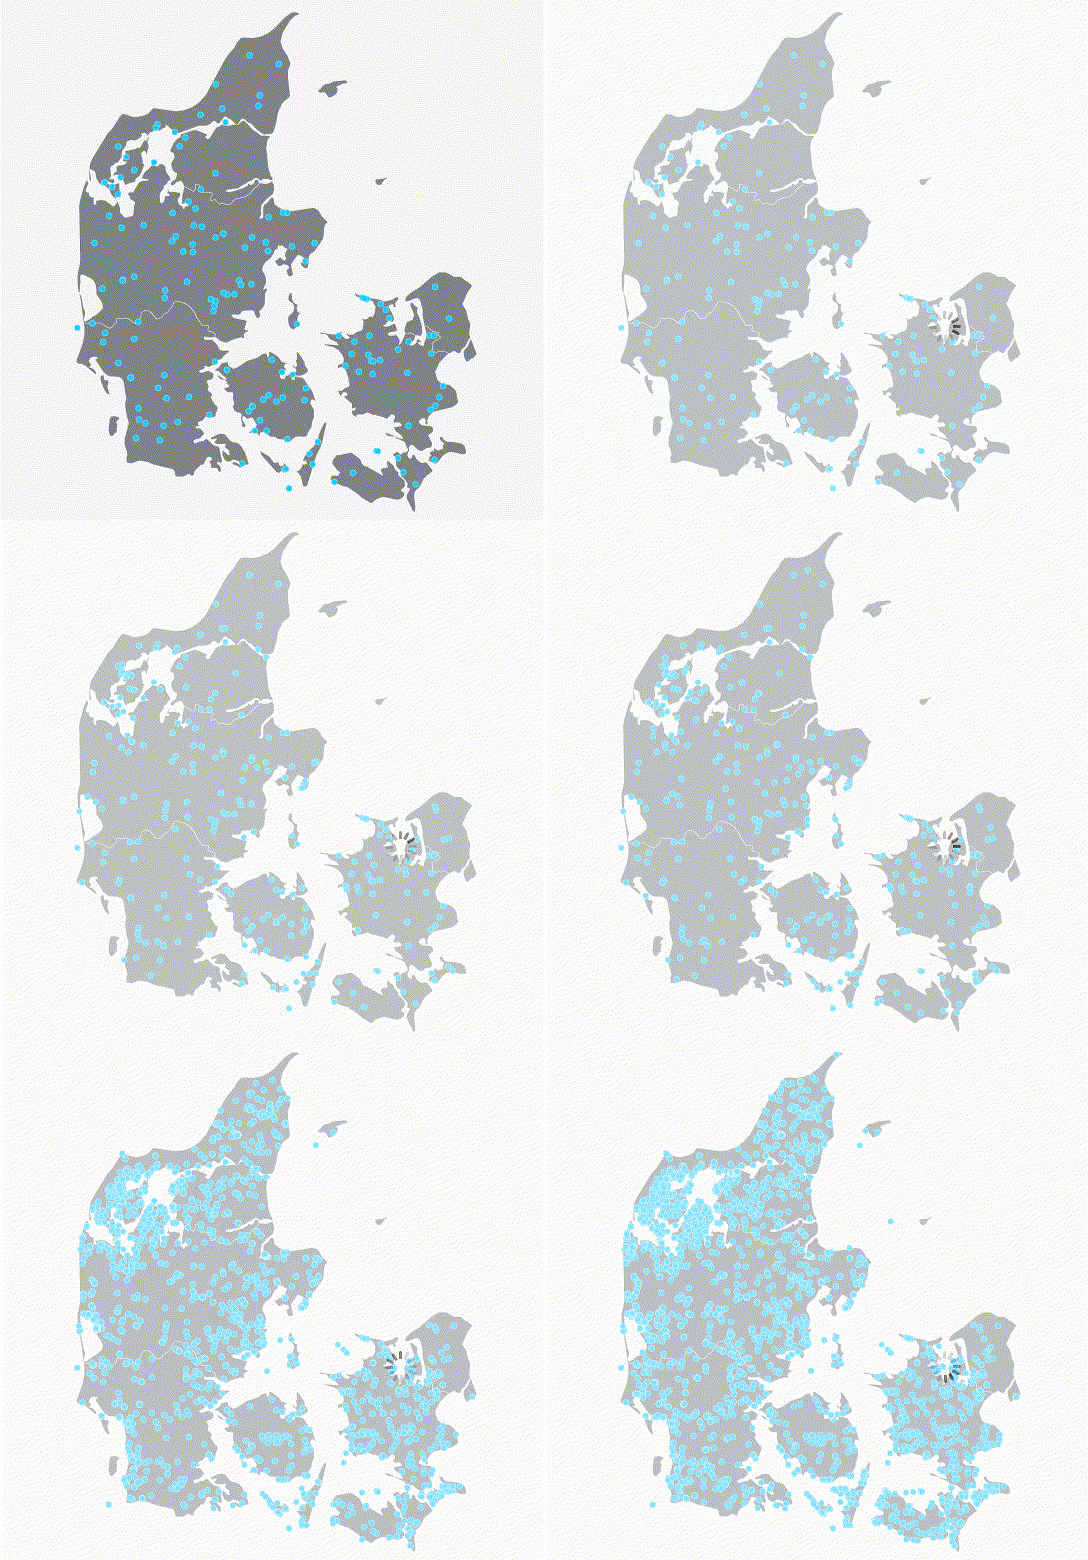
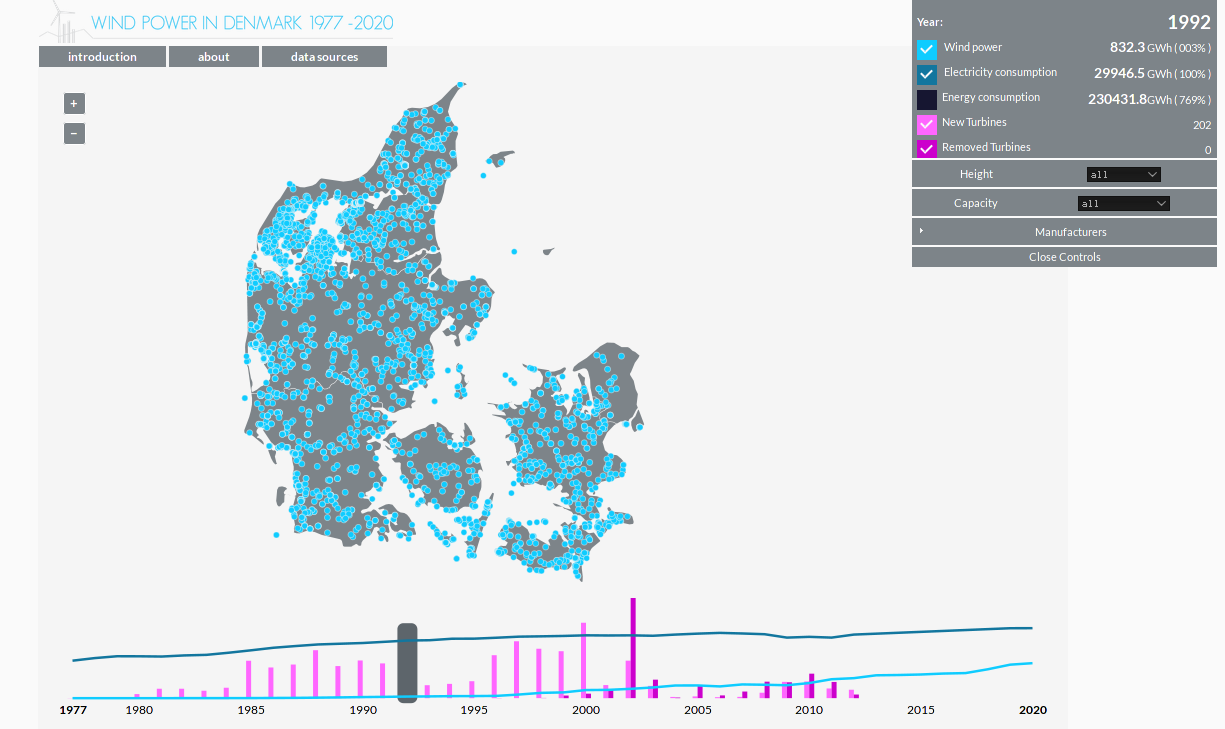
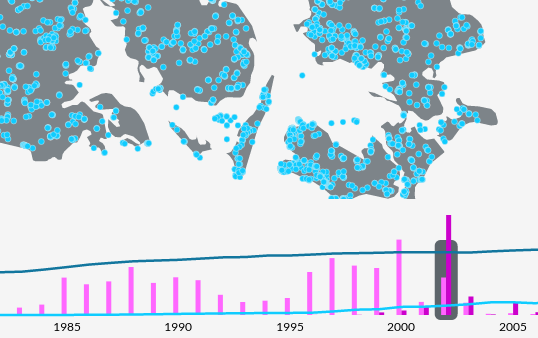
WIND ELECTRICITY IN DENMARK 1977-2020 shows patterns of wind turbines installed – and taken down – in Denmark over the years in combination with total consumption of electricity and gross energy.

In close feedback loop with the client, we researched and build a bespoke visualization that combines an interactive map with other indicators to create a coherent picture of the relationship between wind turbines, electricity production and electricity consumption across time in Denmark. Based on three separate data sources and combining different perspectives the tool was meant to stir interest amongst professionals and laypeople alike, by providing insight into data source which previously haven’t been correlated in an accessible manner.

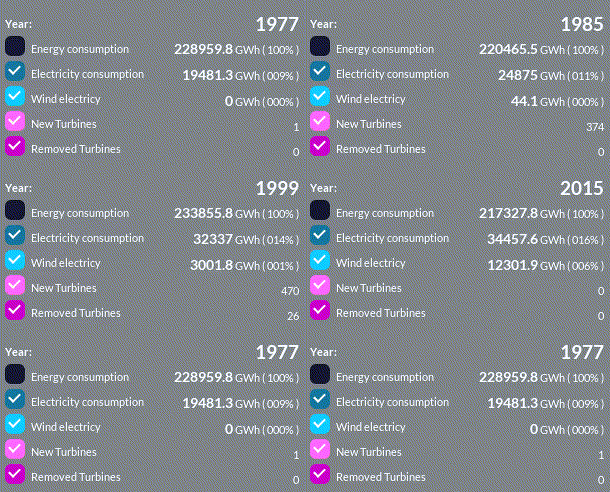
Moving the mouse over the graph allows you to follow the values for wind electricy production and consumption of electricy and energy changing in the box at the right.

