I build software that uses data as its raw material: the interfaces that make it legible, the services that feed them, and, increasingly, the platform underneath. More...
UI Kit
April '26
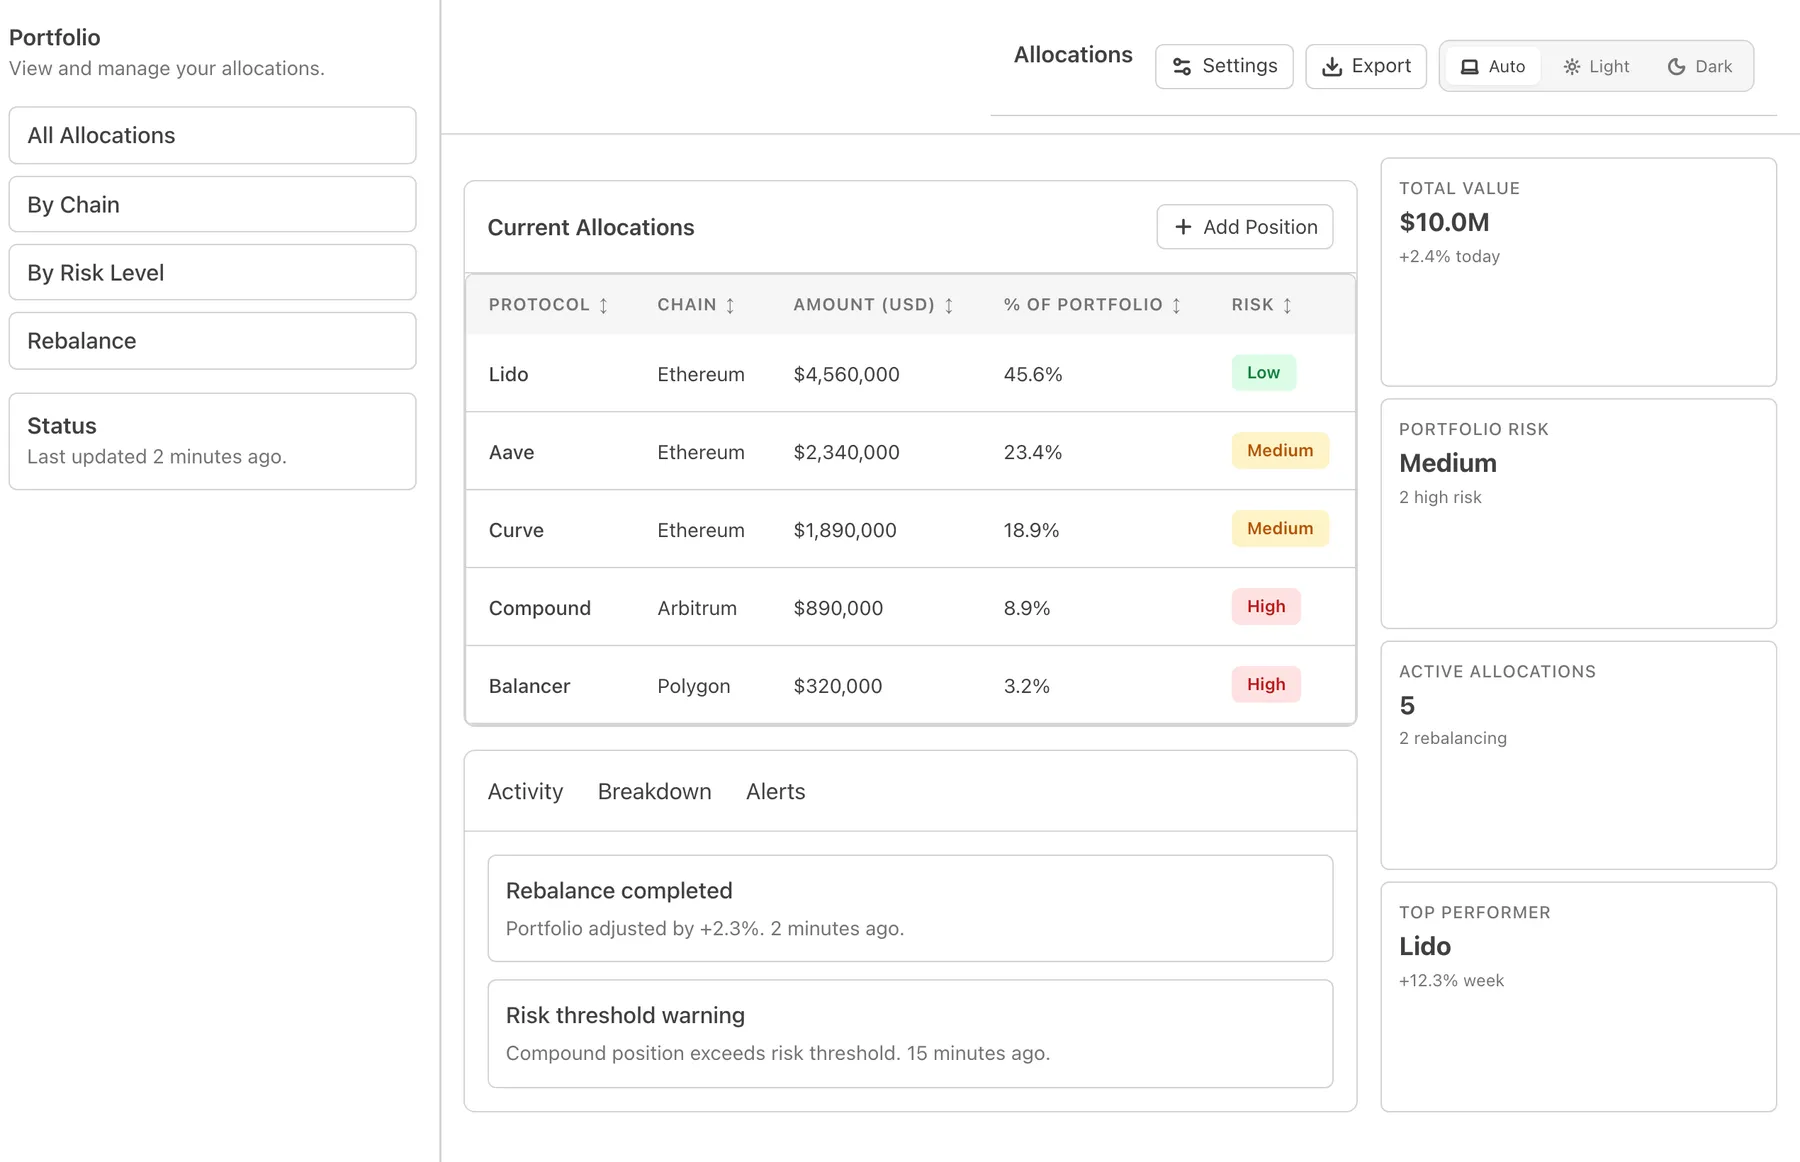
A shared front-end toolkit for a company whose products all show the same kind of thing (positions, balances, risk, movement over time), and had each been building the furniture for it separately....
At: Archon Tech
Sentinel Verify
April '26
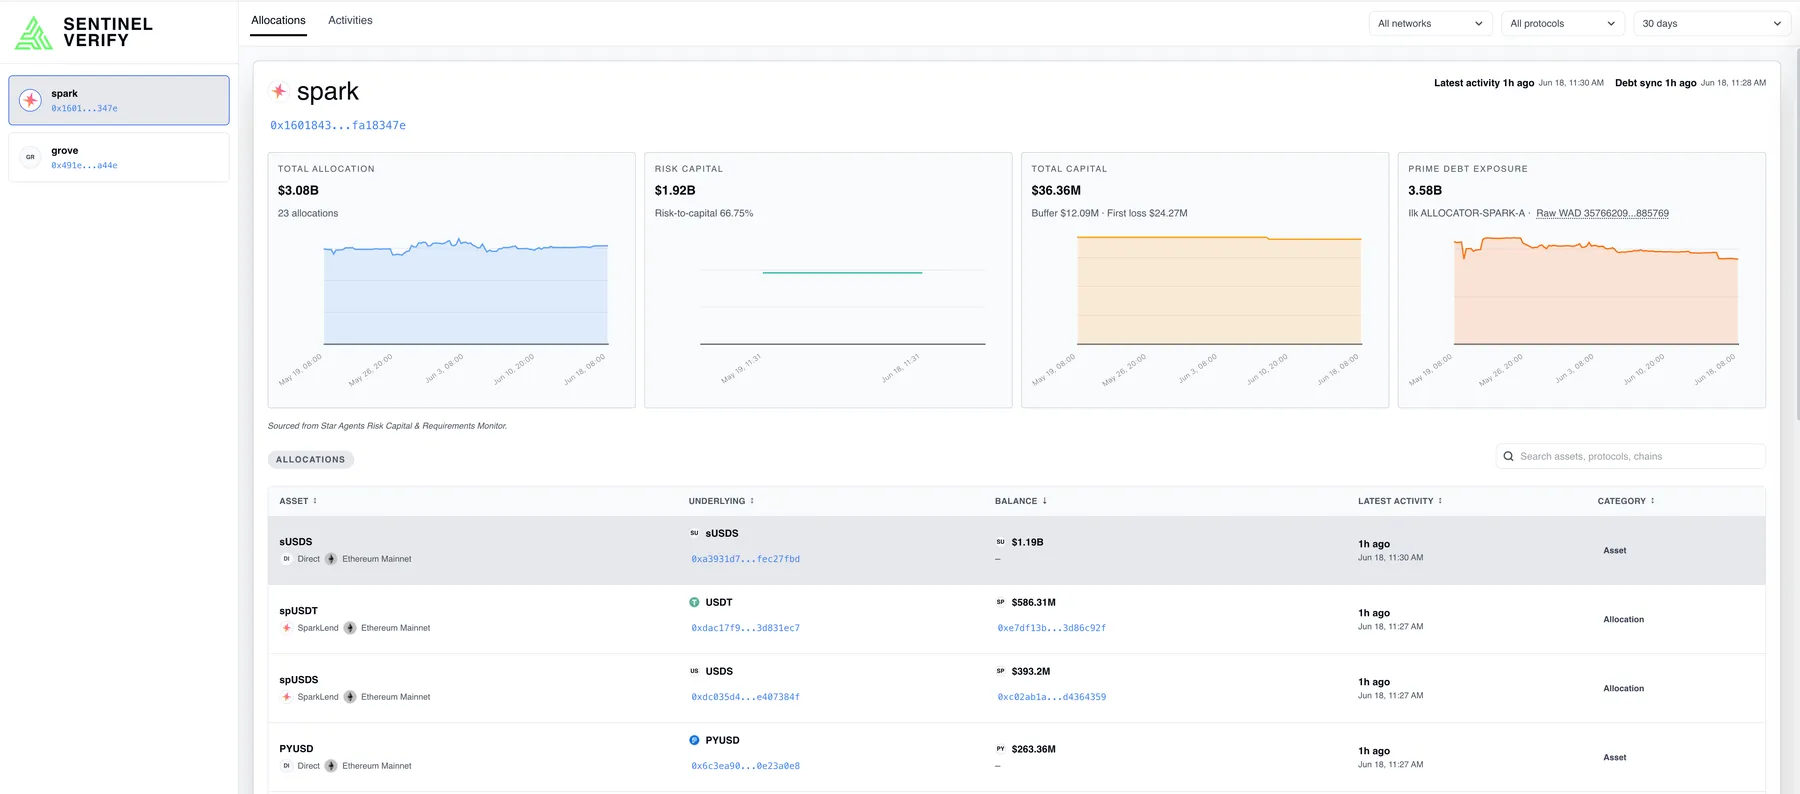
A dashboard over a platform that watches Ethereum and its layer twos in real time, indexes what lending protocols are holding, and works out how much capital is at risk; then checks its own answer against the one the protocol publishes about itself....
At: Archon Tech
Chatbot for sky.money
November '25
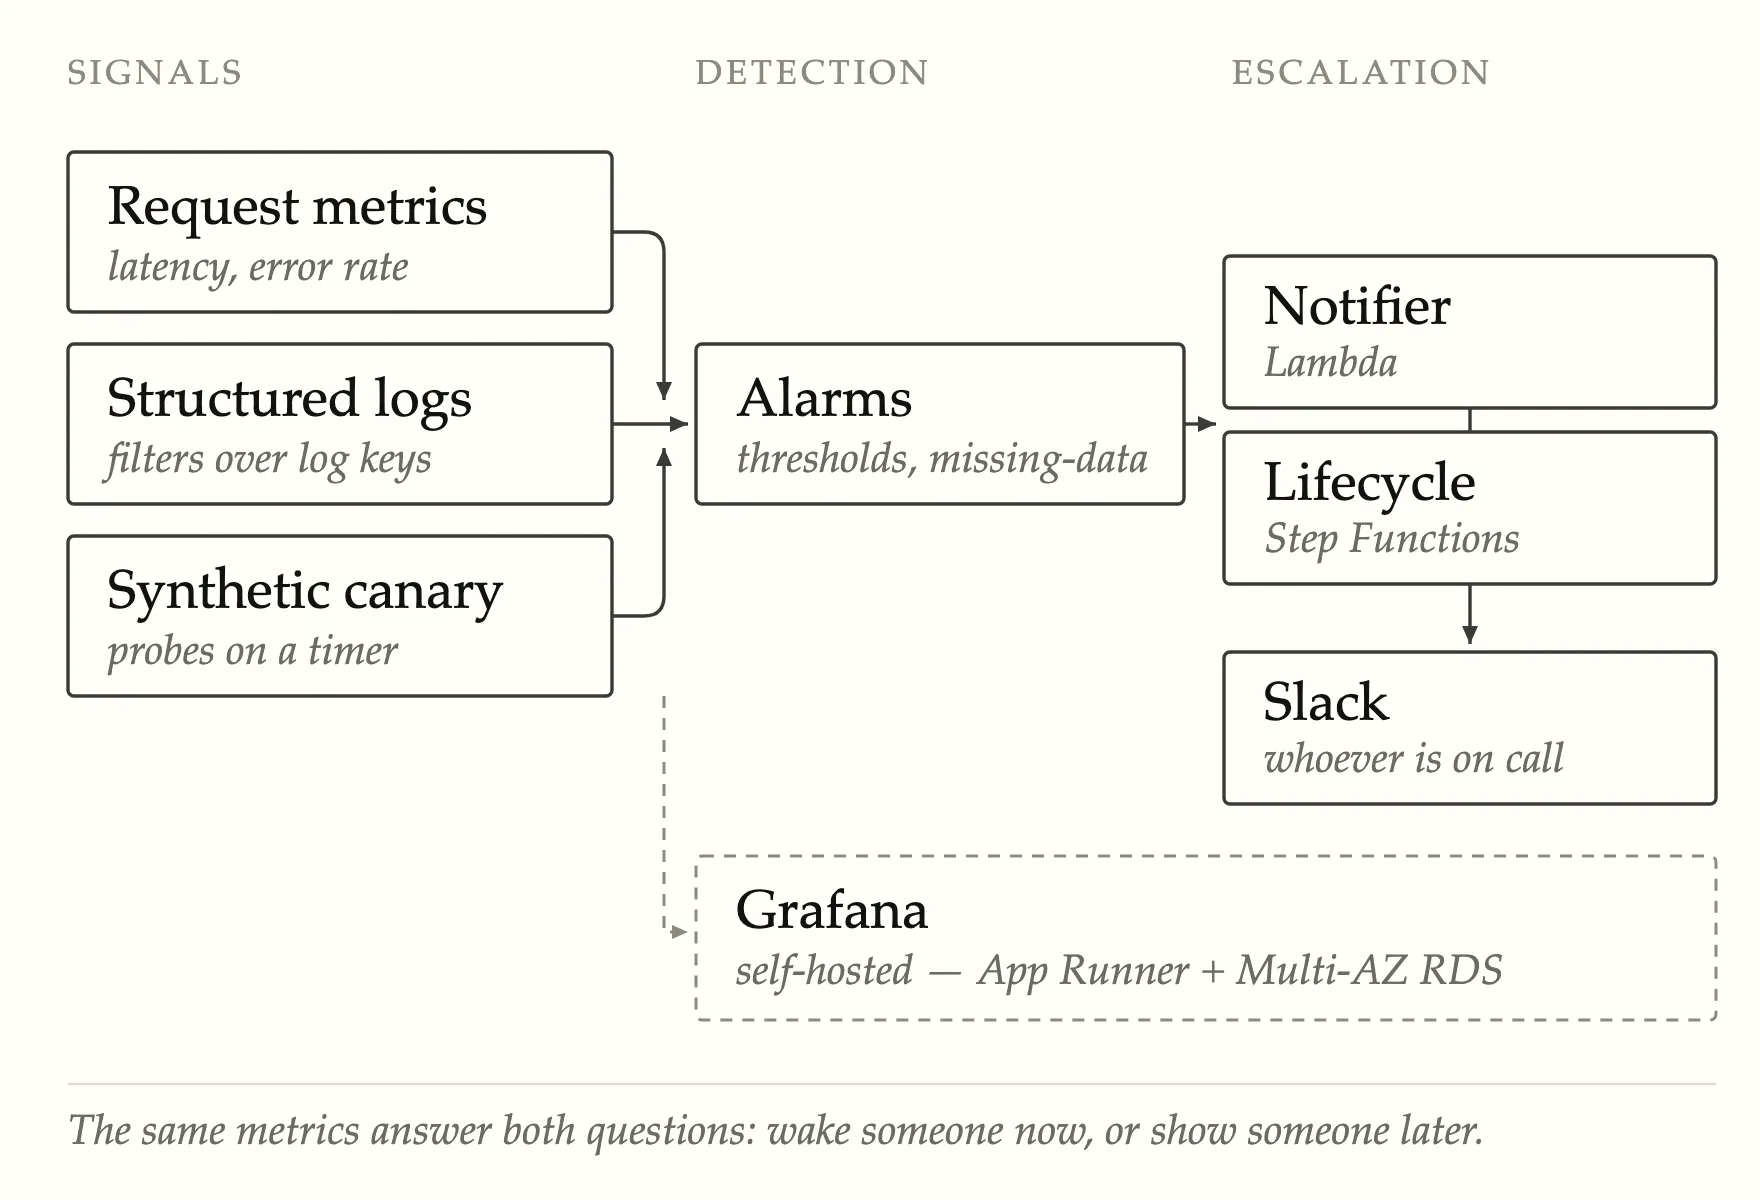
An AI assistant that shipped inside a DeFi application, answering questions about a user’s positions and walking them through actions. My work was the layer that told us whether it was healthy: alarms, paging and dashboards, built from an empty infrastructure repository....
At: Archon Tech
Metrics & Log Inventory
September '25
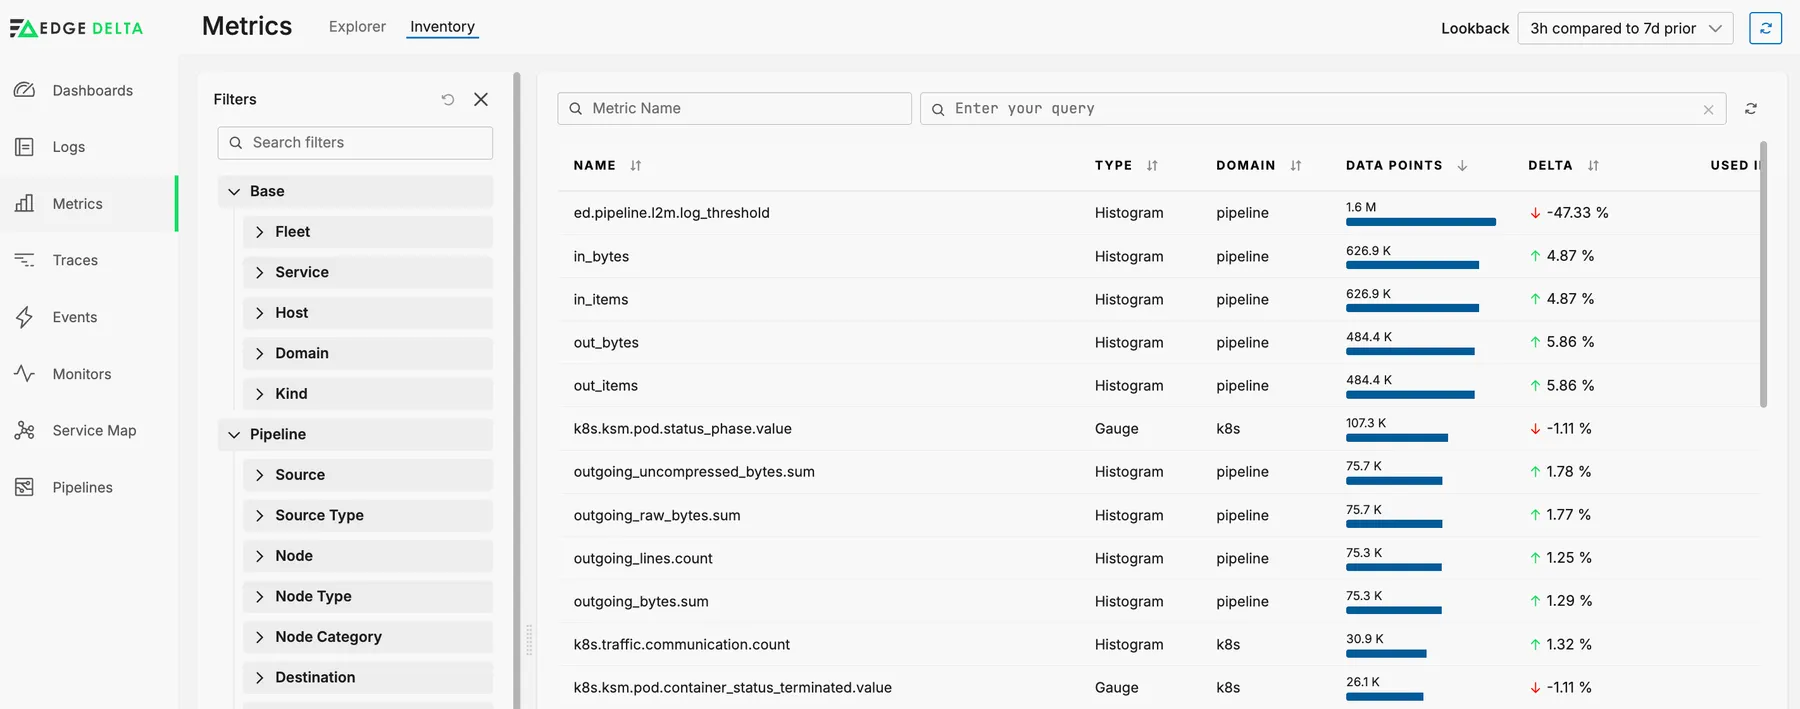
A telemetry pipeline will happily emit ten thousand distinct metrics and a terabyte of logs, and nobody in the organisation knows what most of it is. Two surfaces, built a few months apart, answering the same question of each half: what exists, where it came from, what it costs, and whether anything is actually reading it....
At: Edge Delta
Service Map
April '25
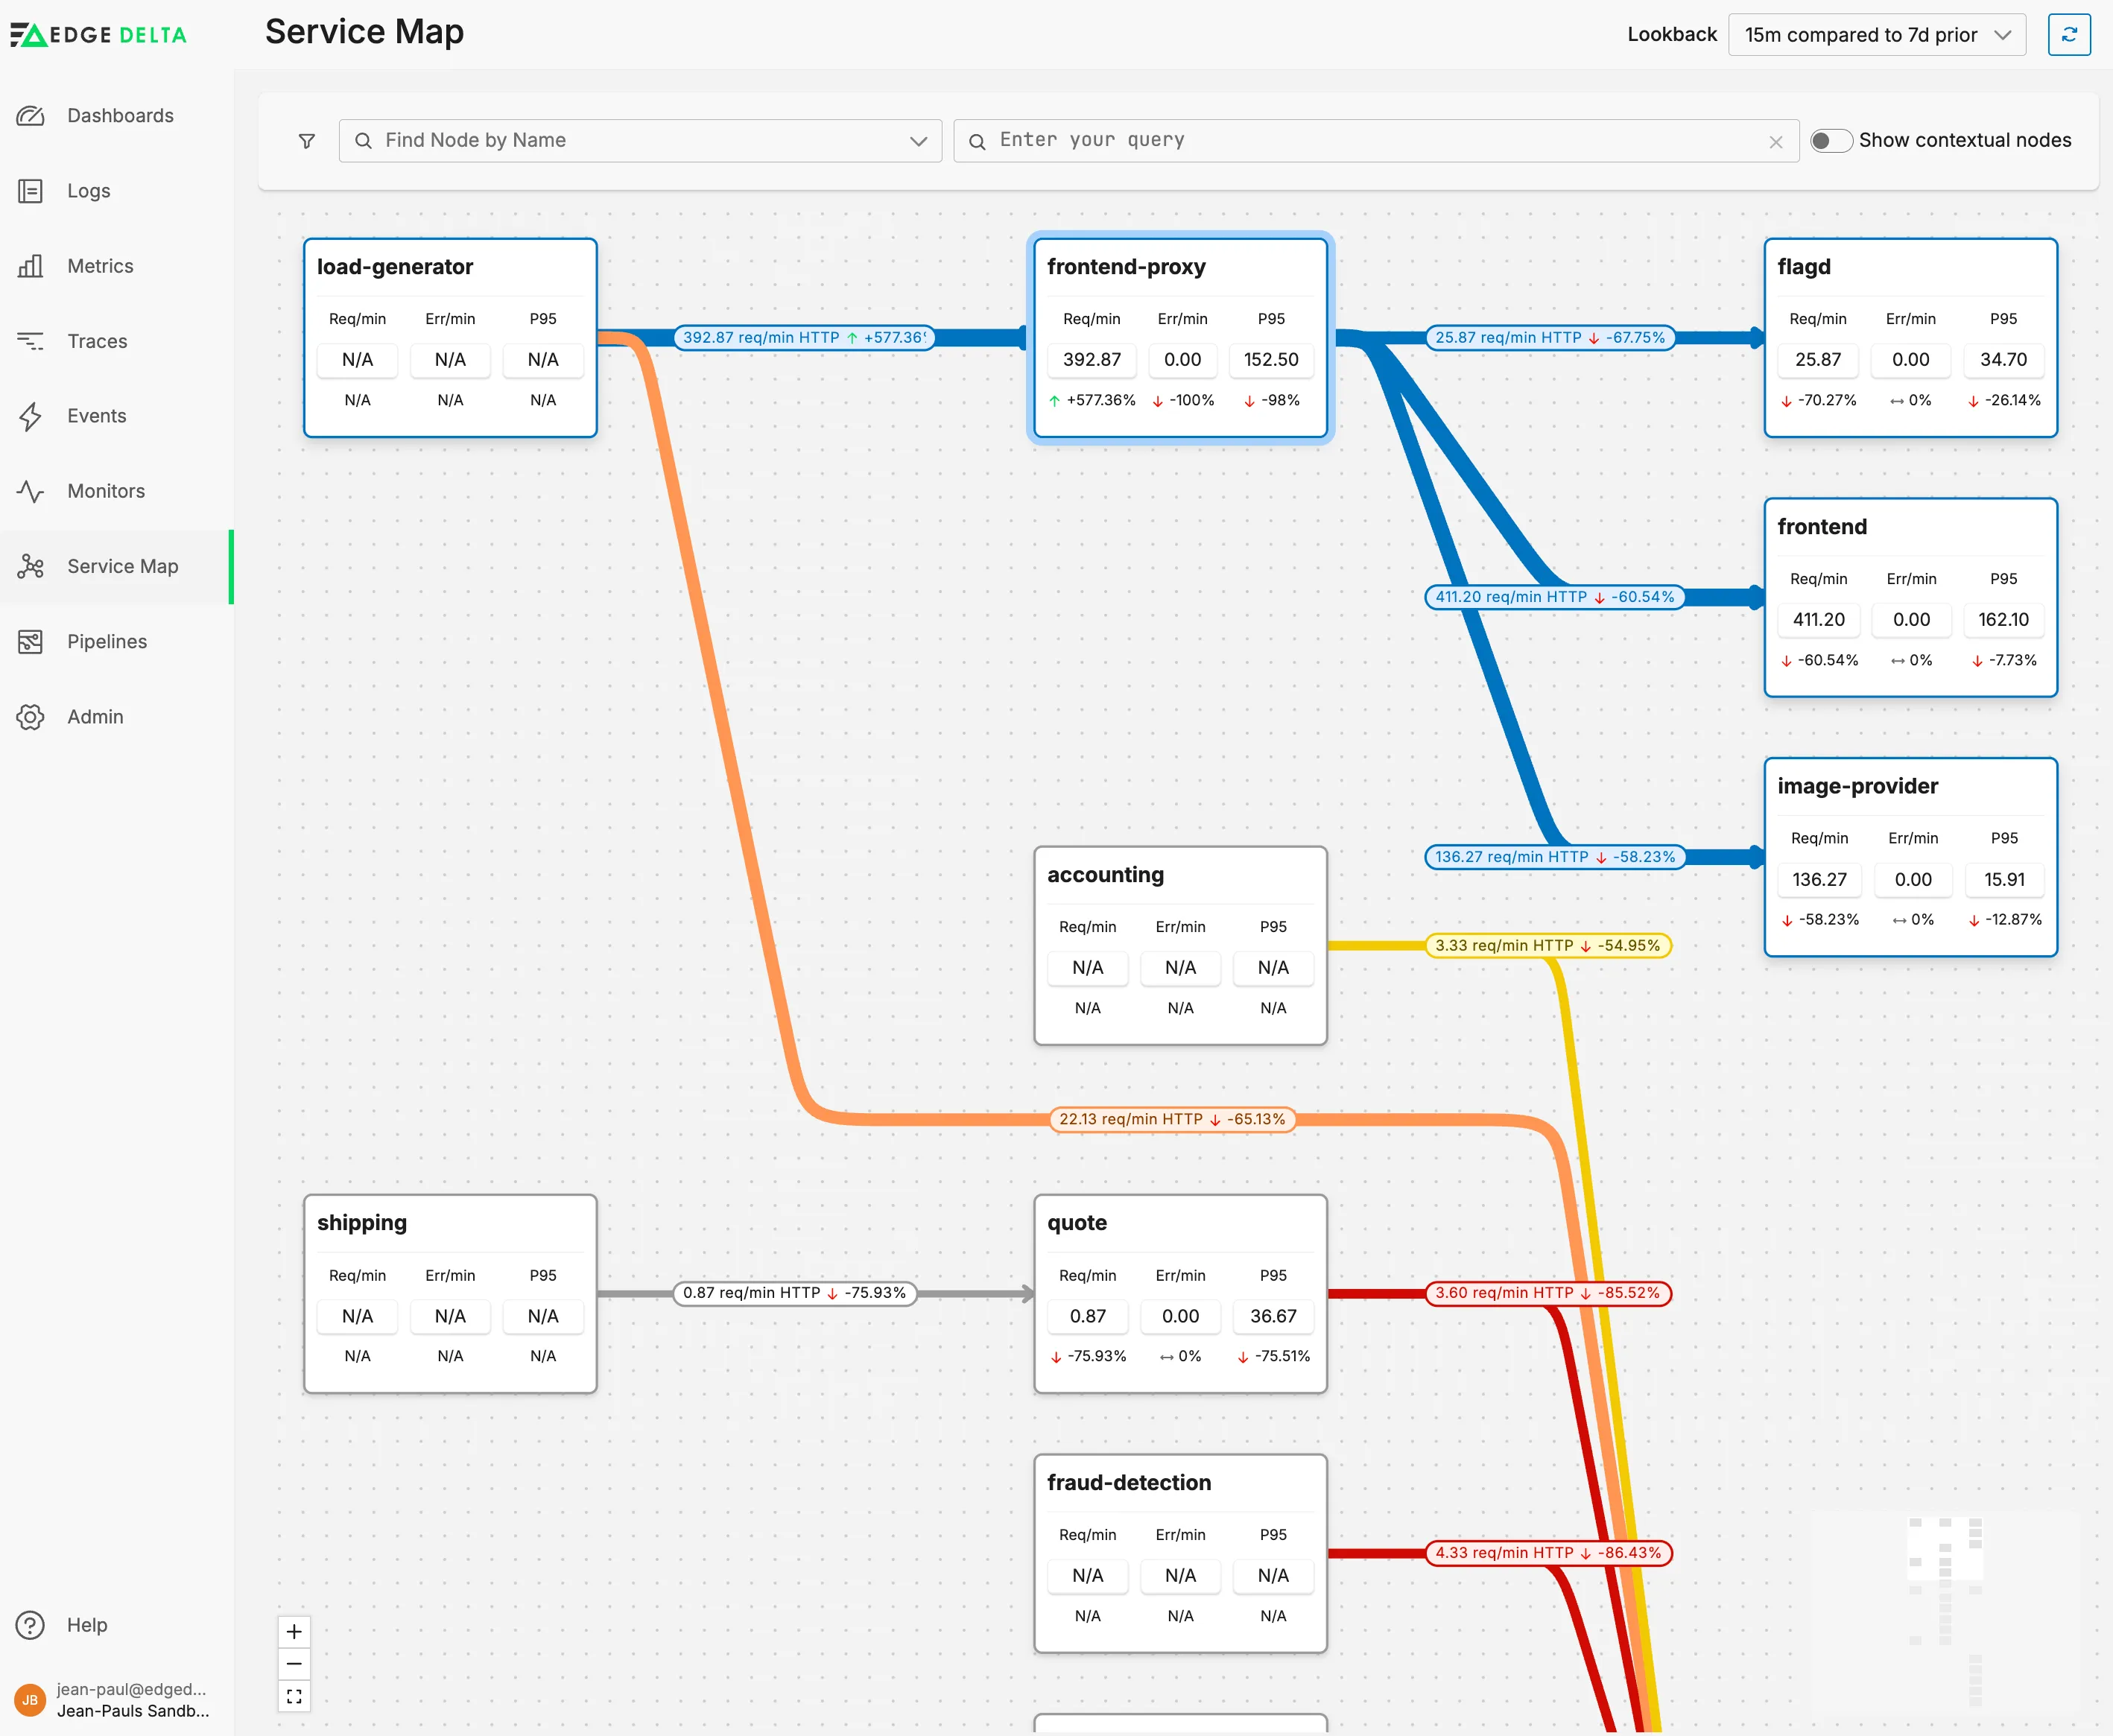
A live node-link graph of service-to-service traffic, drawn from kernel-level observation rather than instrumentation, with error rate and latency encoded on the graph itself....
At: Edge Delta
Grammars & Language Support
March '25
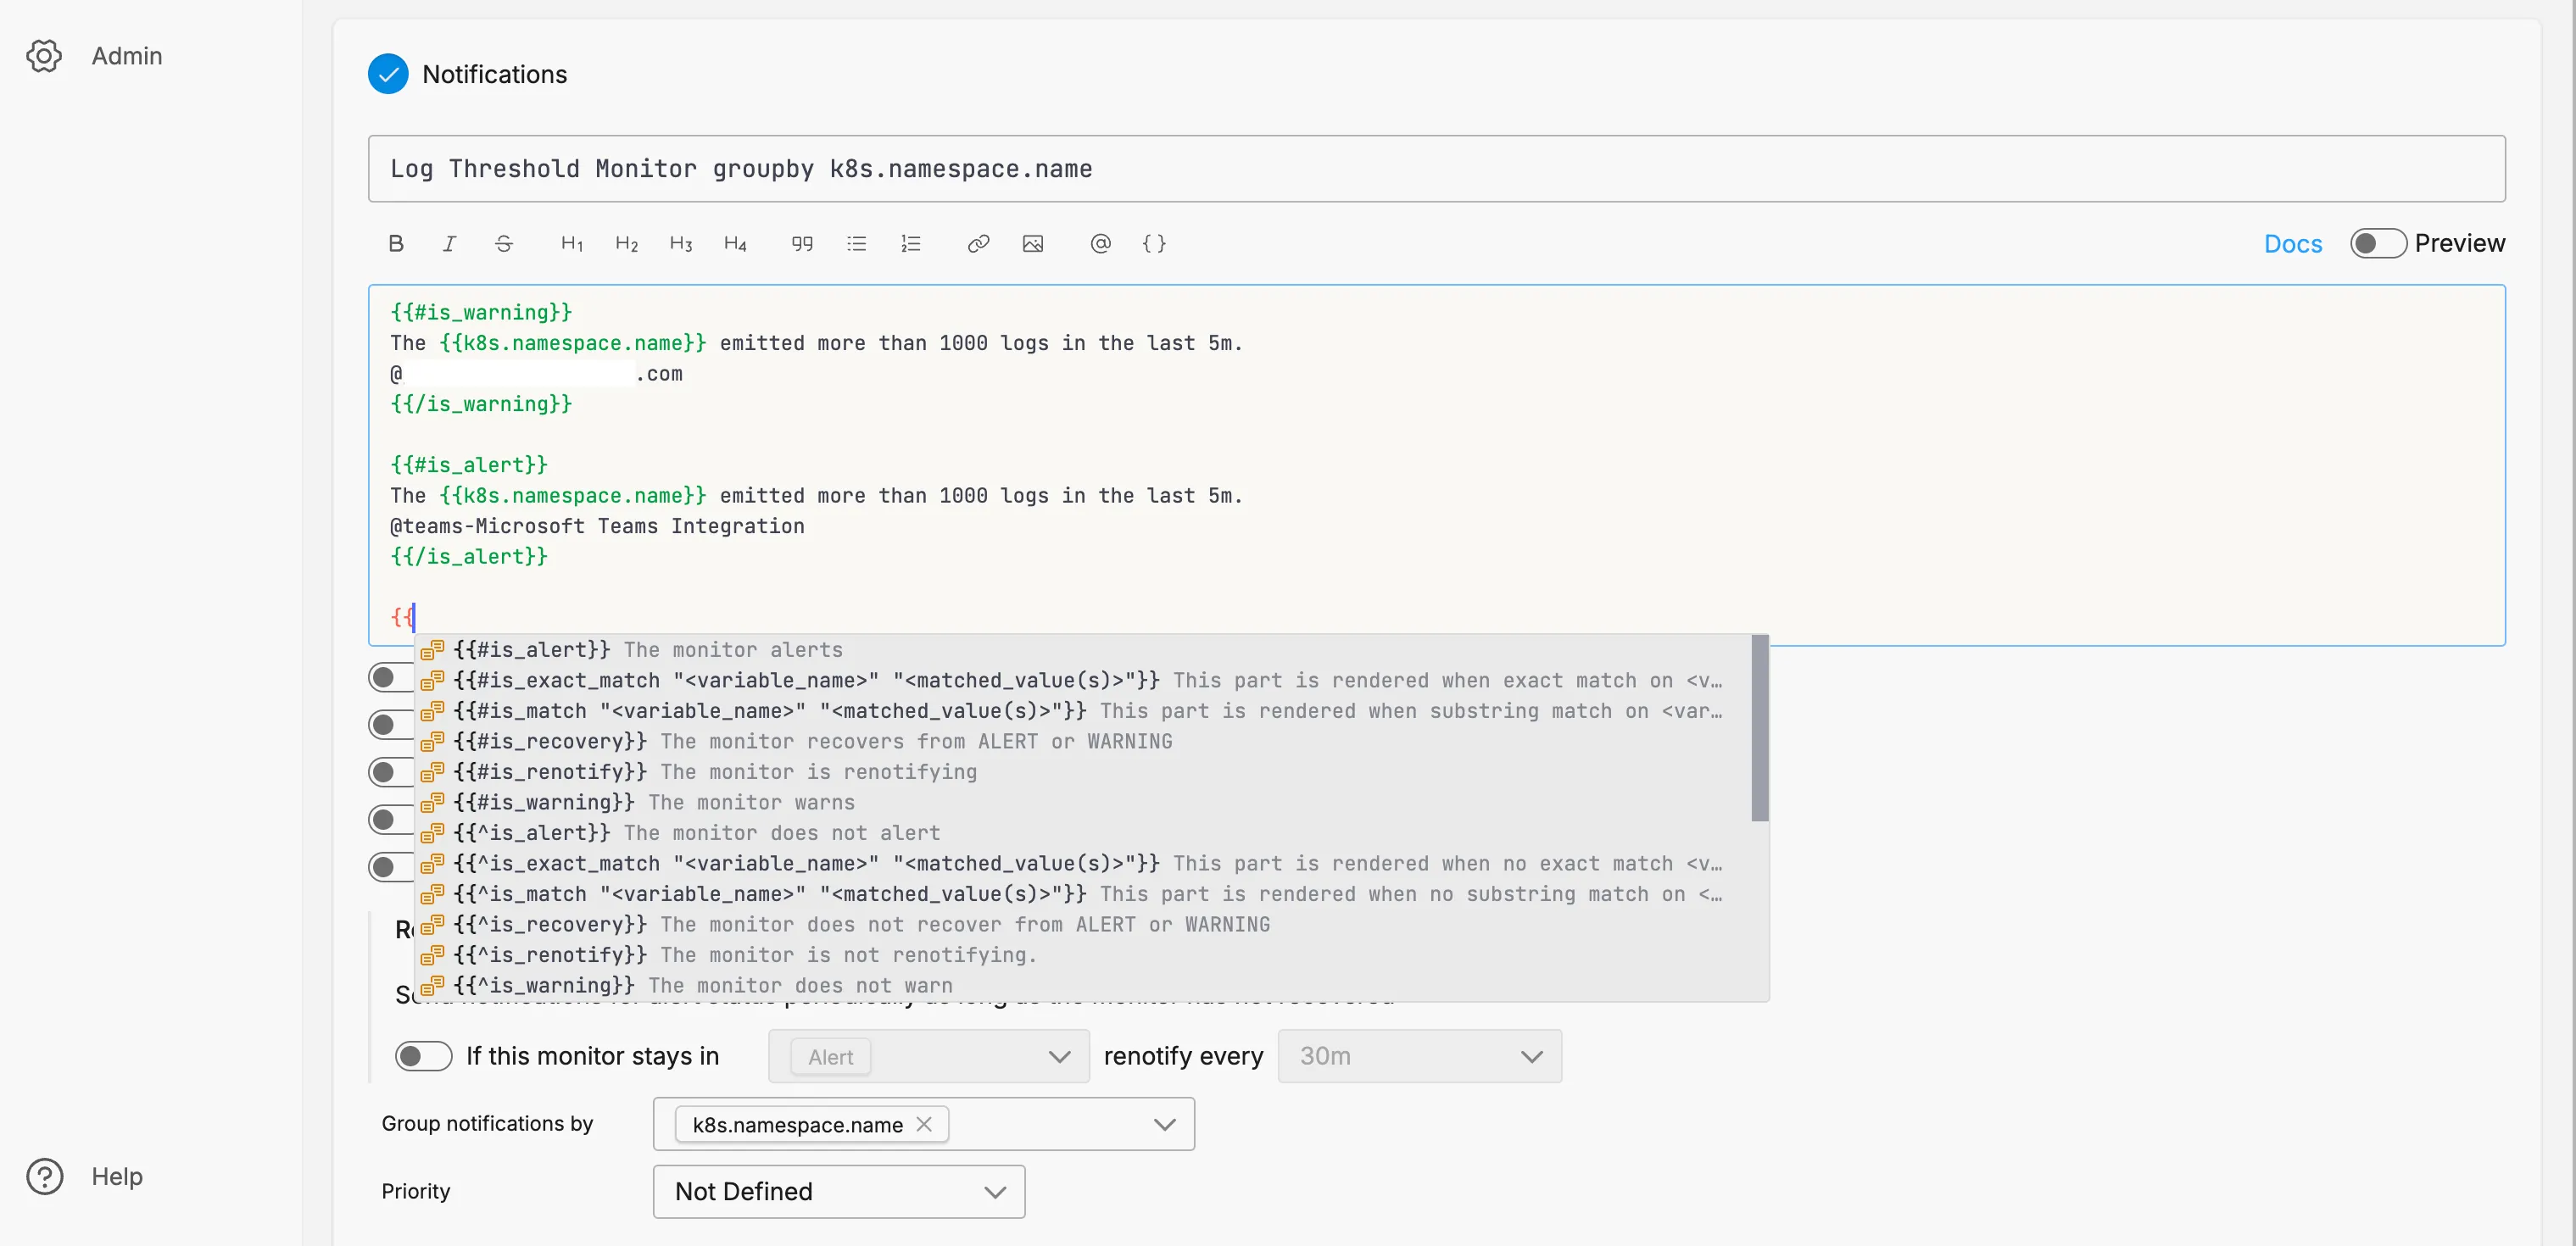
A compiler front end, shipped inside a web application, by the person who also built the interface it powers. Two ANTLR grammars and the editor on top of them: a templating language for monitor notifications where the conditionals decide who gets paged, and the boolean expression that composes monitors out of each other....
At: Edge Delta
Monitors
July '24
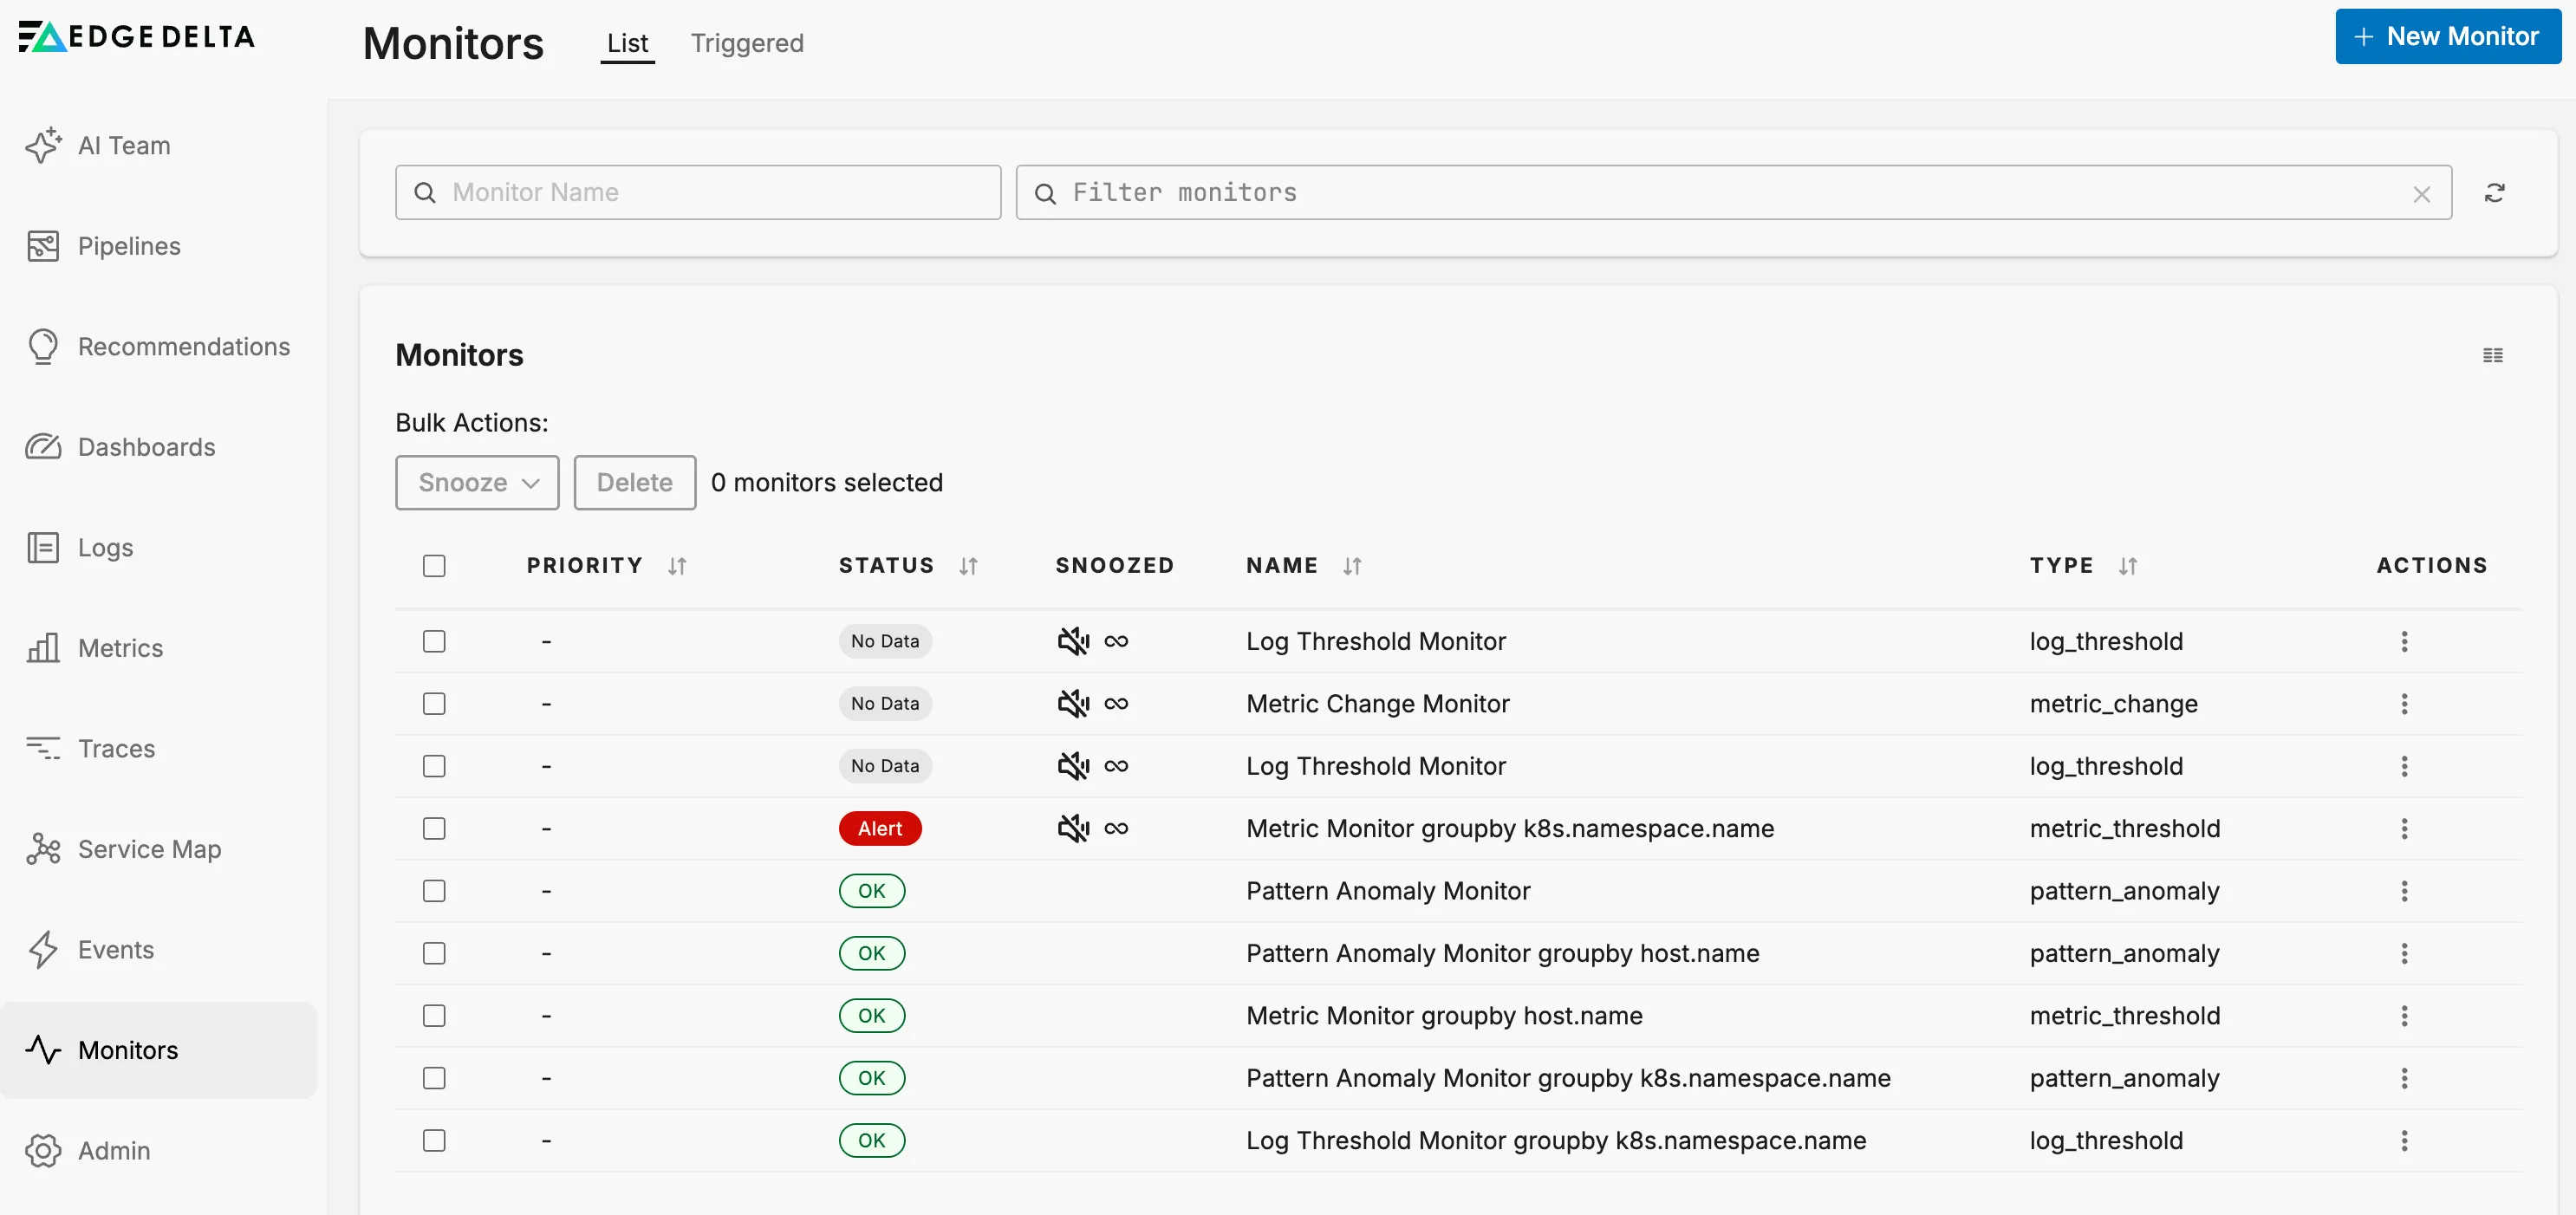
An overhaul of how a monitor collection is managed, splitting one overloaded screen into surfaces for status, management and event history; then, eight months later, a way to compose monitors out of each other....
At: Edge Delta
Metrics Explorer
February '24
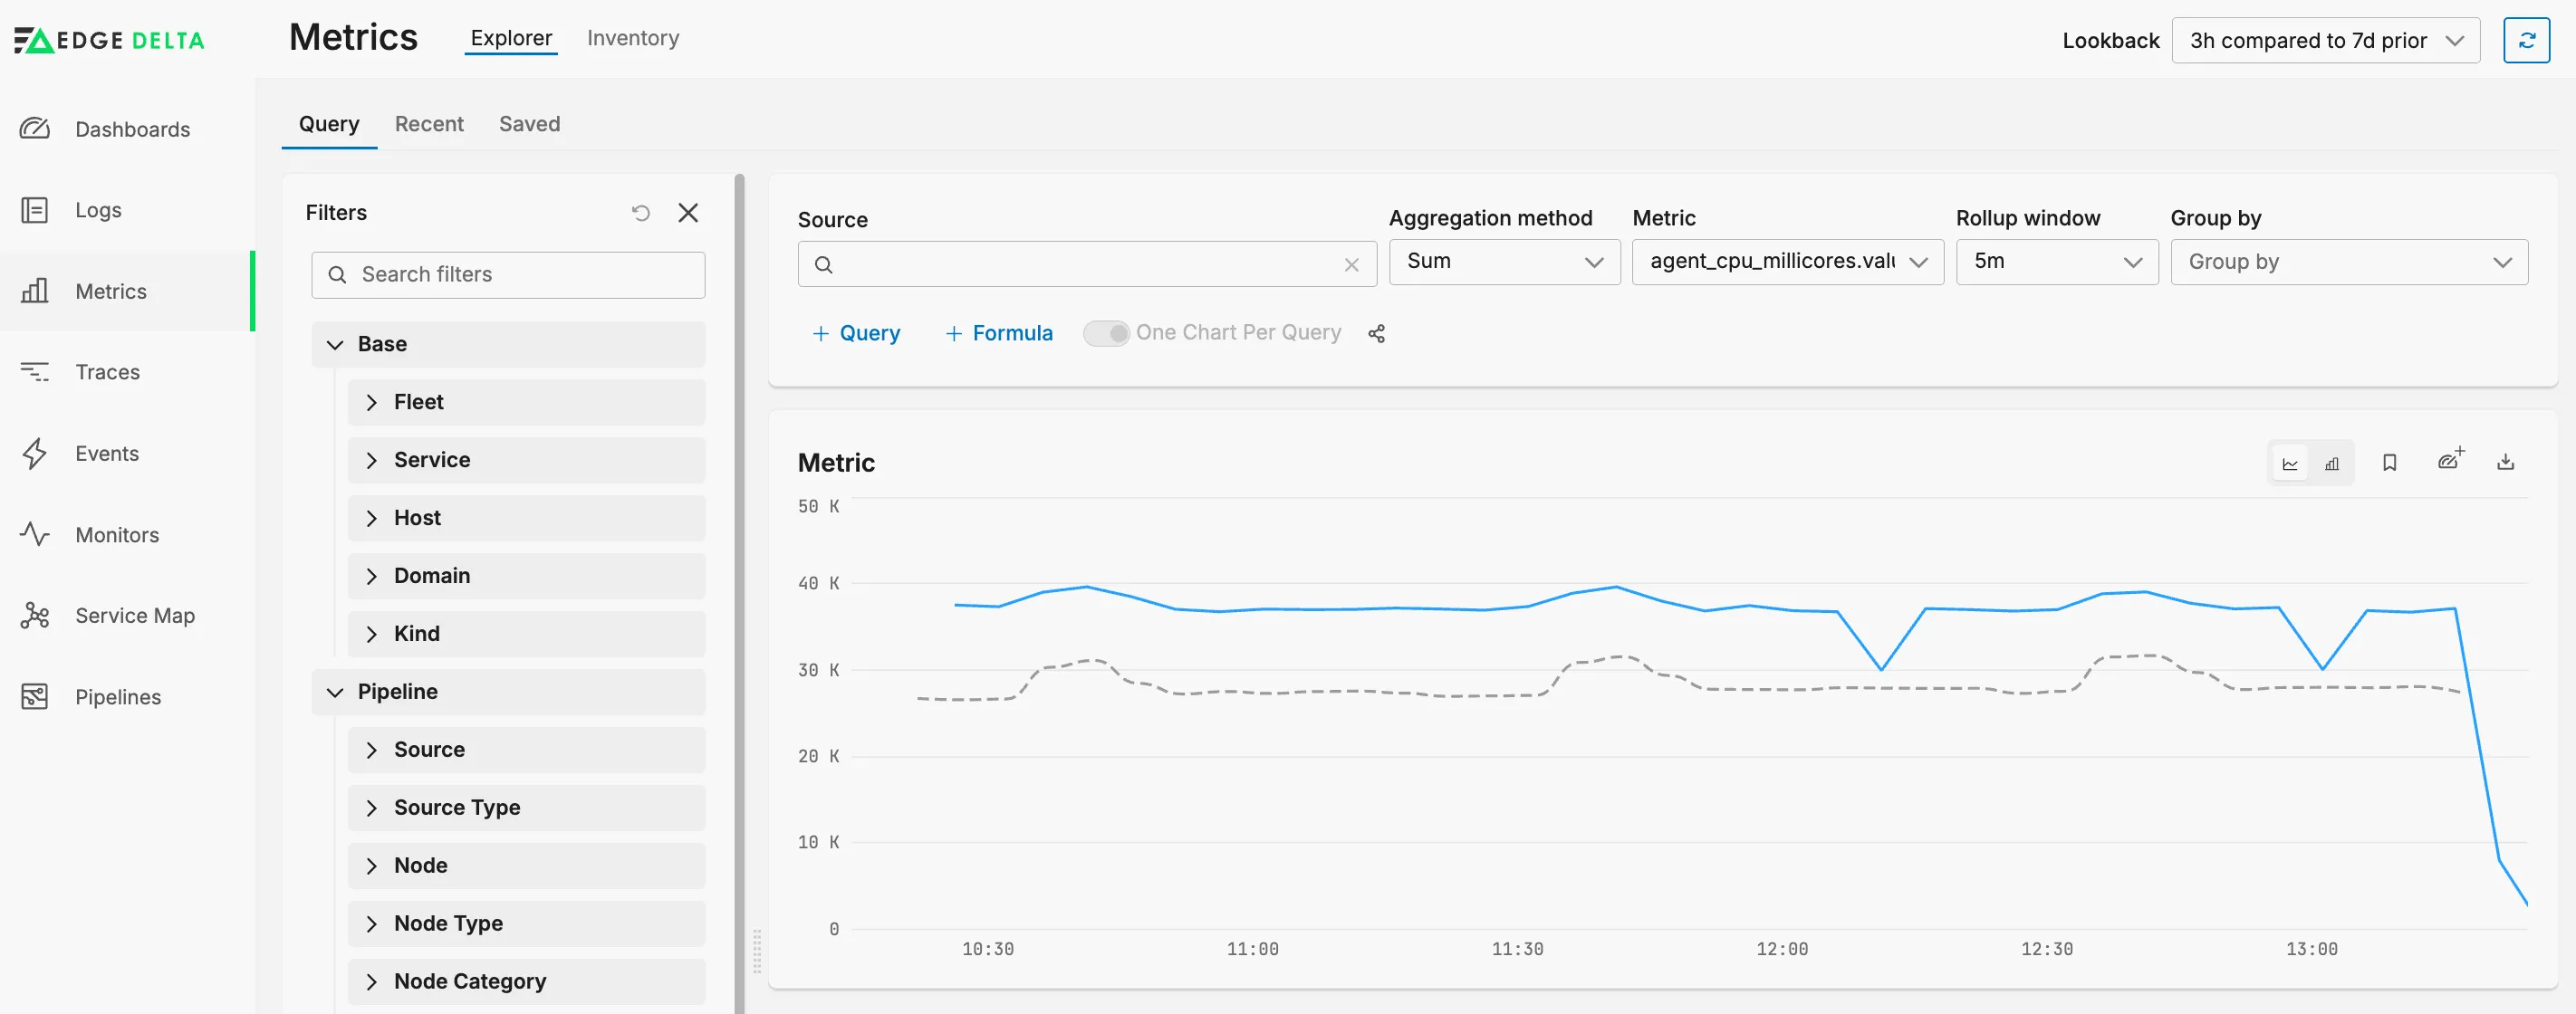
A query and charting surface over every metric Edge Delta ingests or derives, rebuilt on the component system that came out of the React migration, and the place formulas landed first: arithmetic across metrics rather than one metric at a time....
At: Edge Delta
Drift Drill Down
June '22
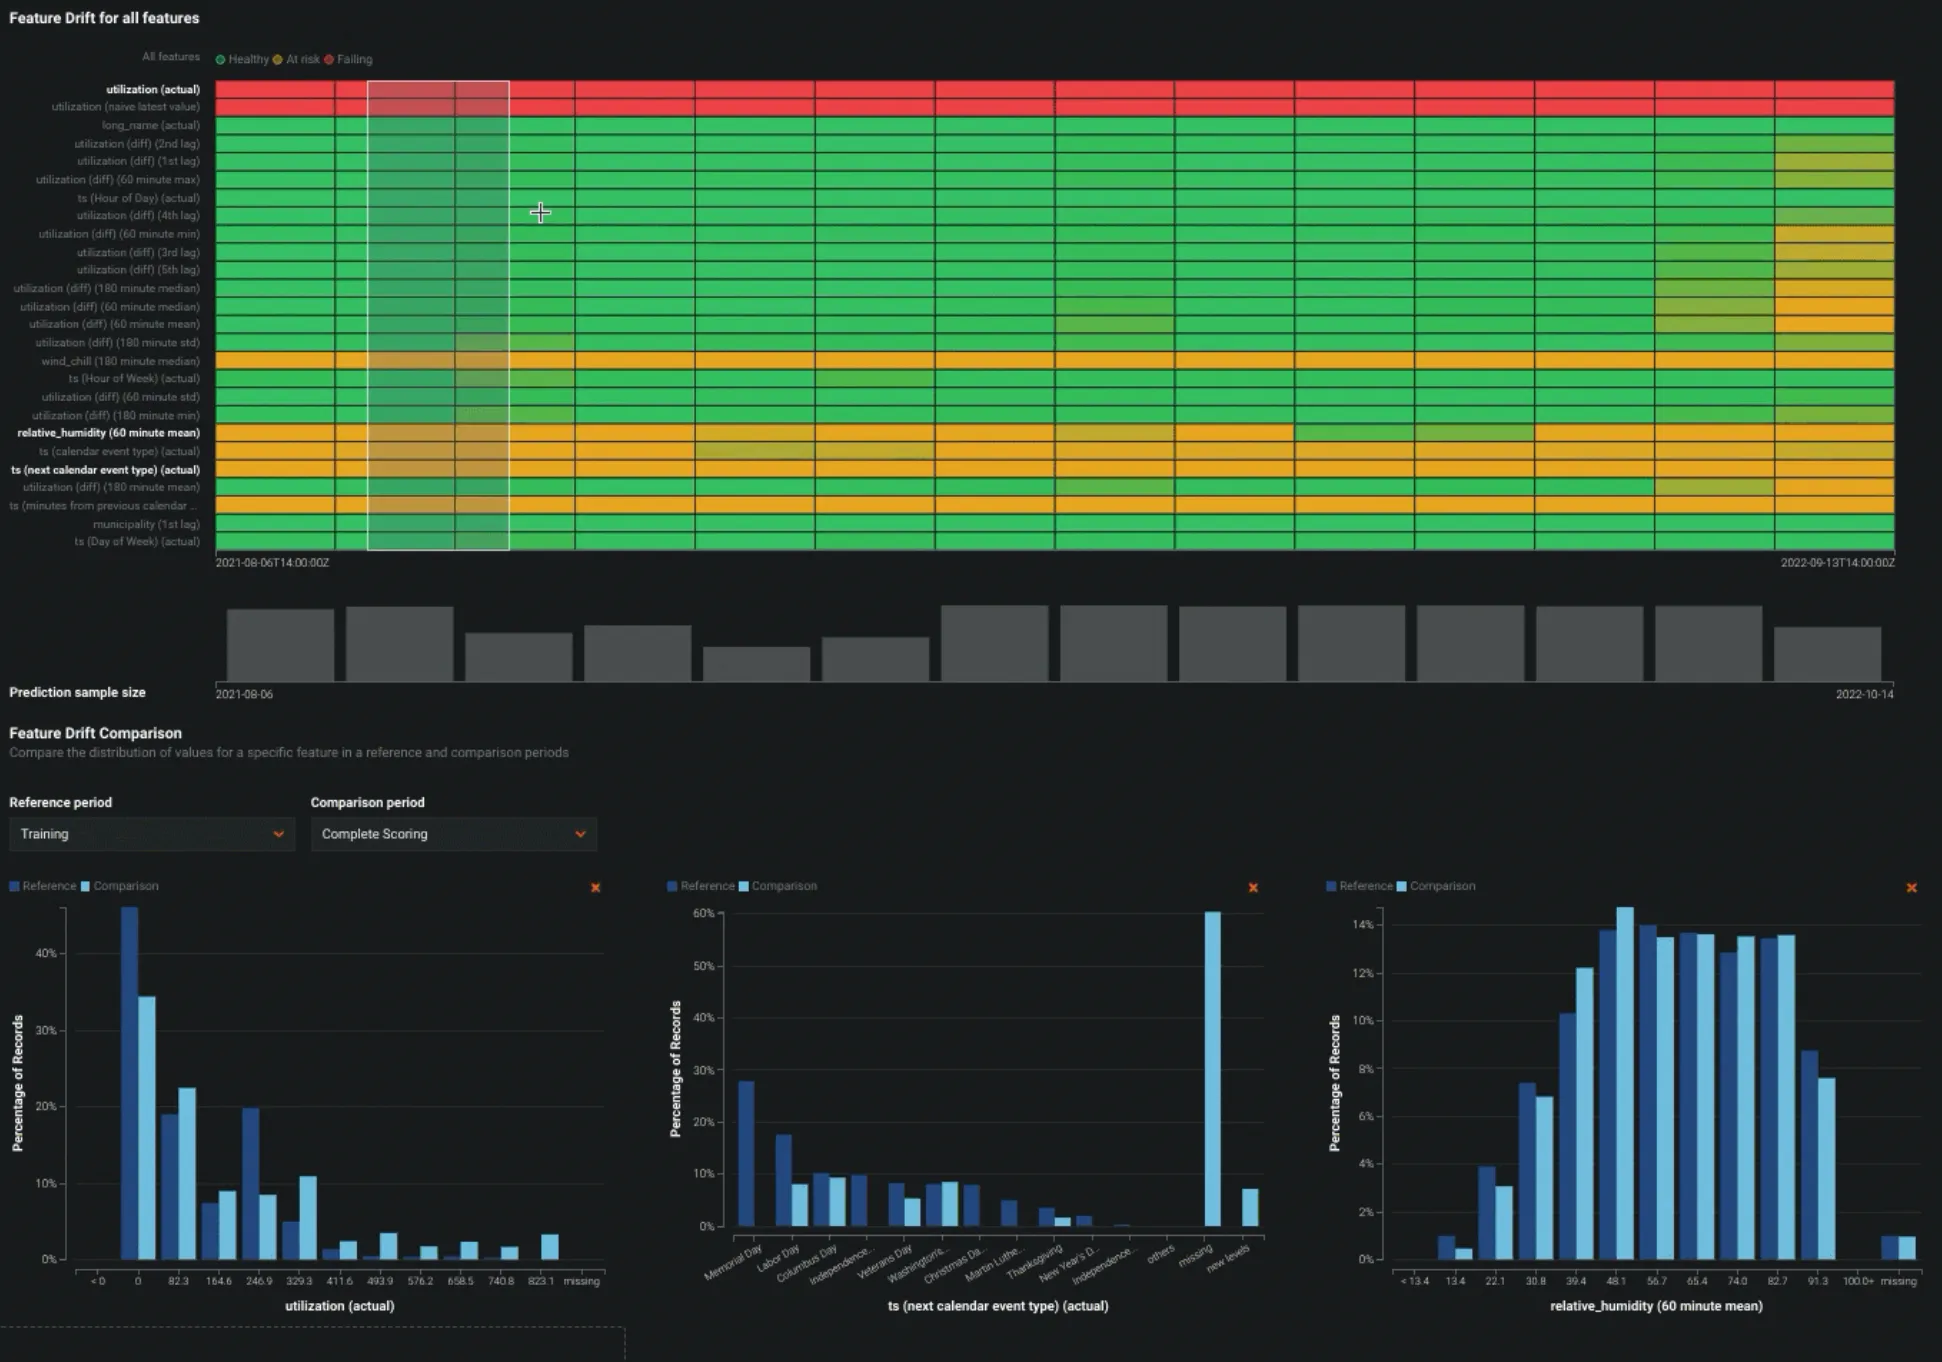
The Drill Down tab shows how the data a deployed model scores in production drifts, feature by feature and over time, away from the data it was trained on....
With: Raúl Pineda
At: DataRobot
Job Definitions UI
September '21
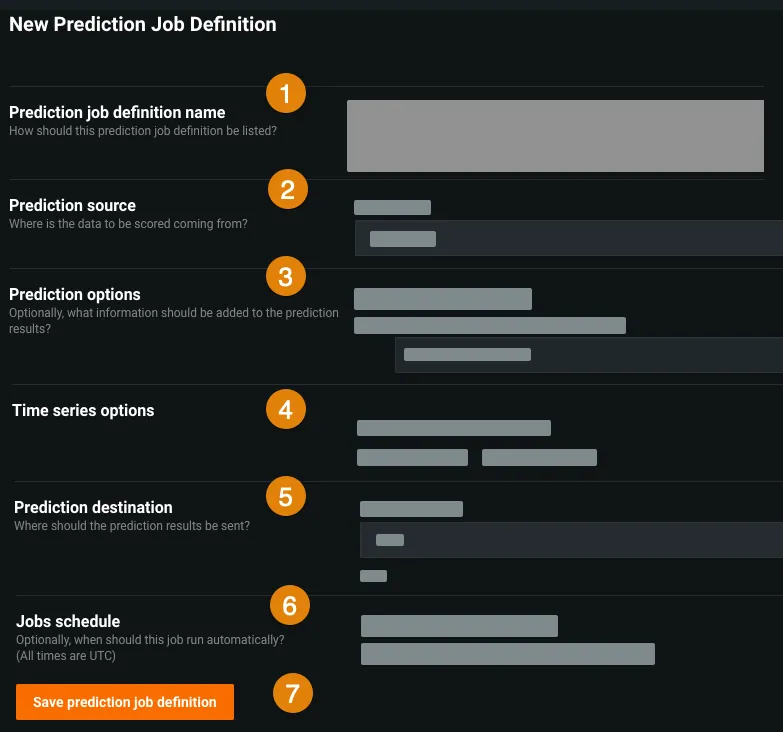
Job definitions let users save a batch prediction job as a template, then run it on demand or on a schedule....
With: Raúl Pineda , Gustavo Ramos Lira
At: DataRobot
Geospatial Domain
December '19
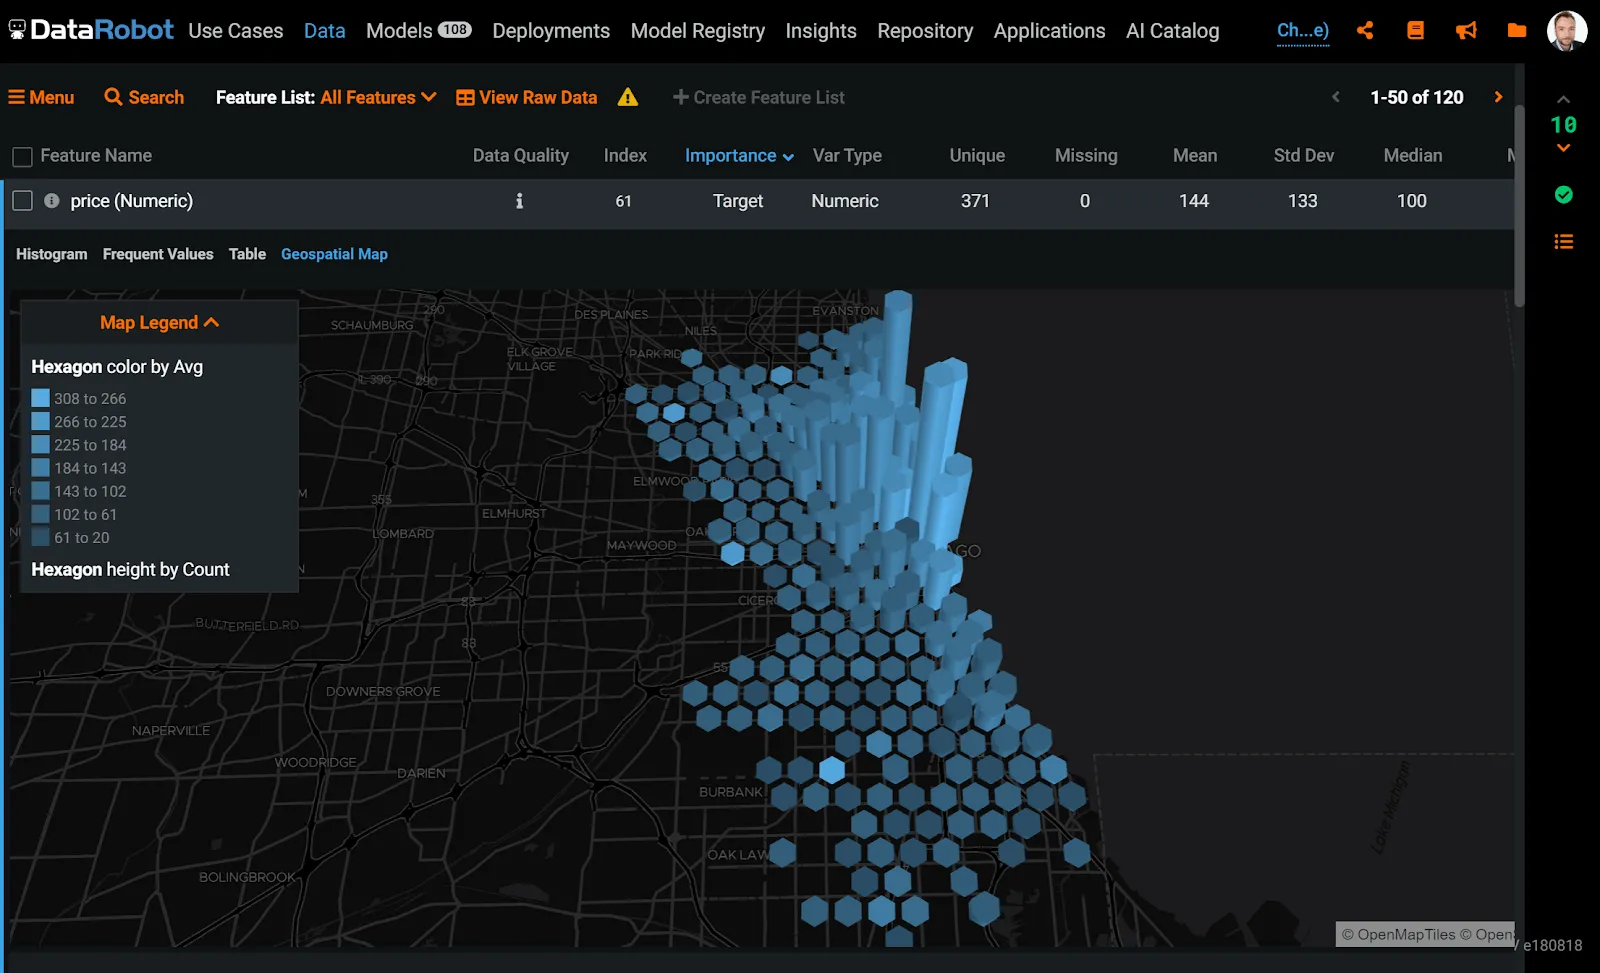
We built the map views in DataRobot’s AutoML platform, for exploring a dataset by location and for seeing where on the map a model’s predictions go wrong....
With: Eric Reyes , Joseph O'Hallaron
At: DataRobot
Ambinode
August '17
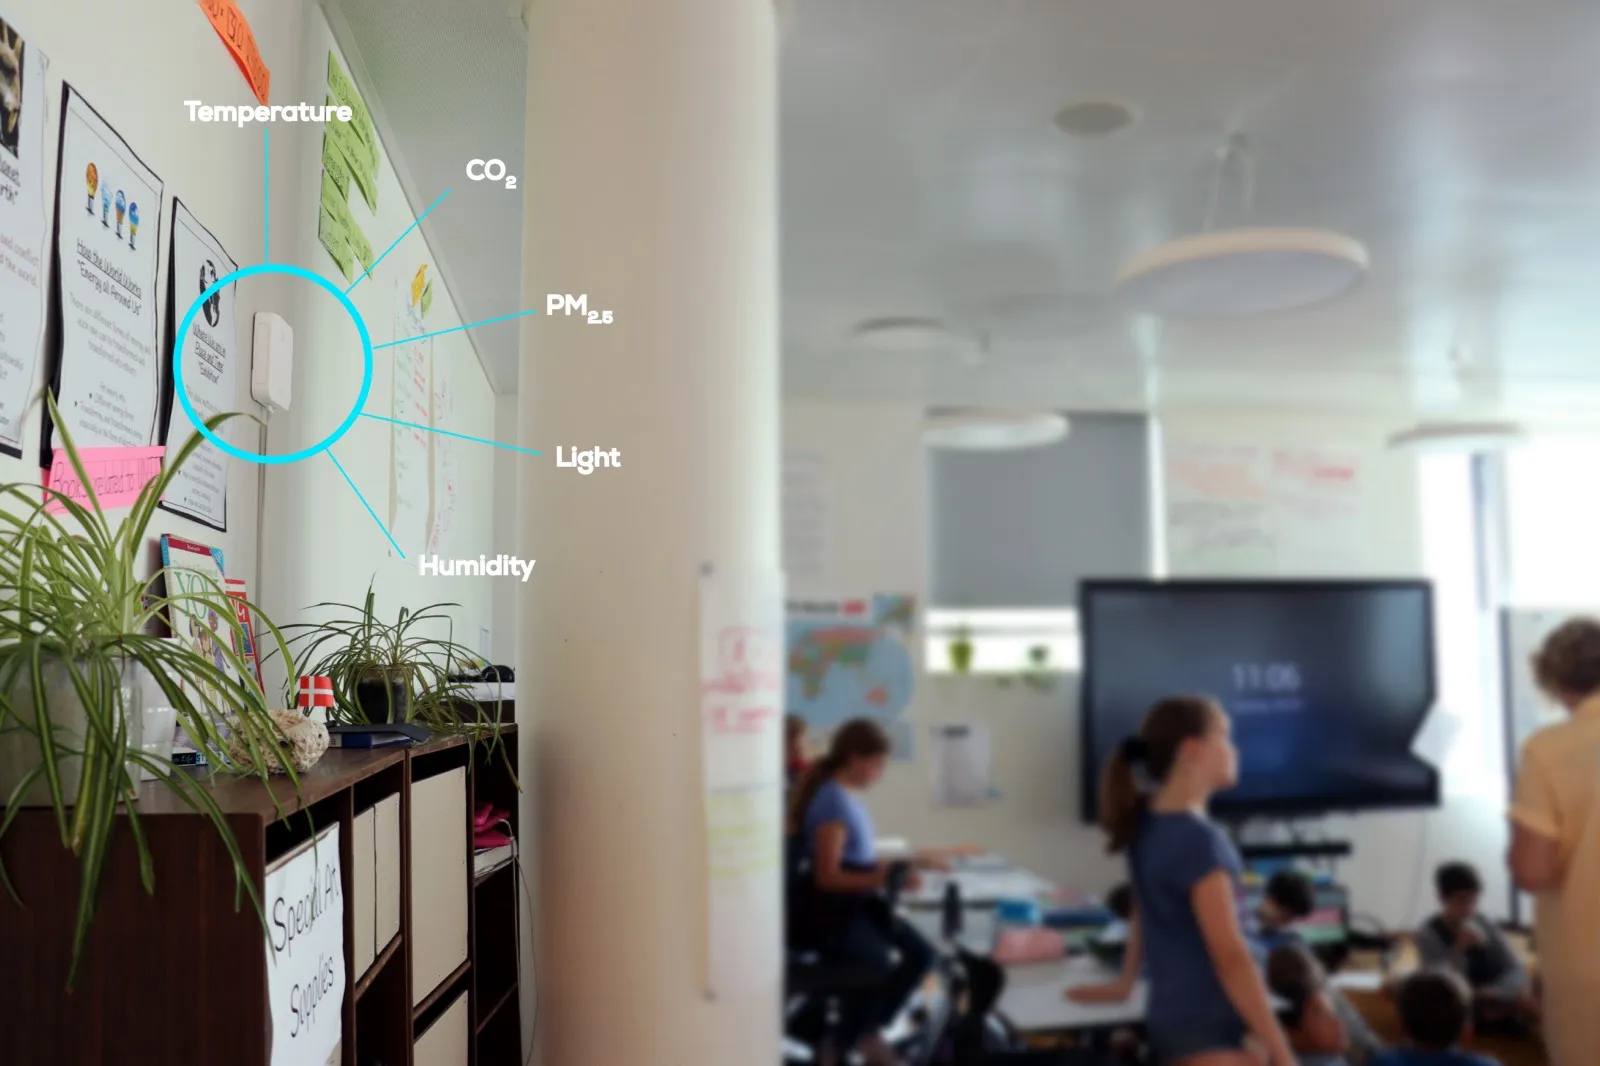
AmbiNode is a wall-mounted indoor climate sensor from Leapcraft, measuring temperature, humidity, CO2, VOCs, particulate matter, noise and light, sold as a service with a mobile app and a cloud behind it....
At: Leapcraft
Cost of War
March '16
This book lists violent incidents and accompanying civilian deaths in Iraq between 20 March 2003 and 18 December 2011....
With: Shobhan Shah

Flight Sense
April '15
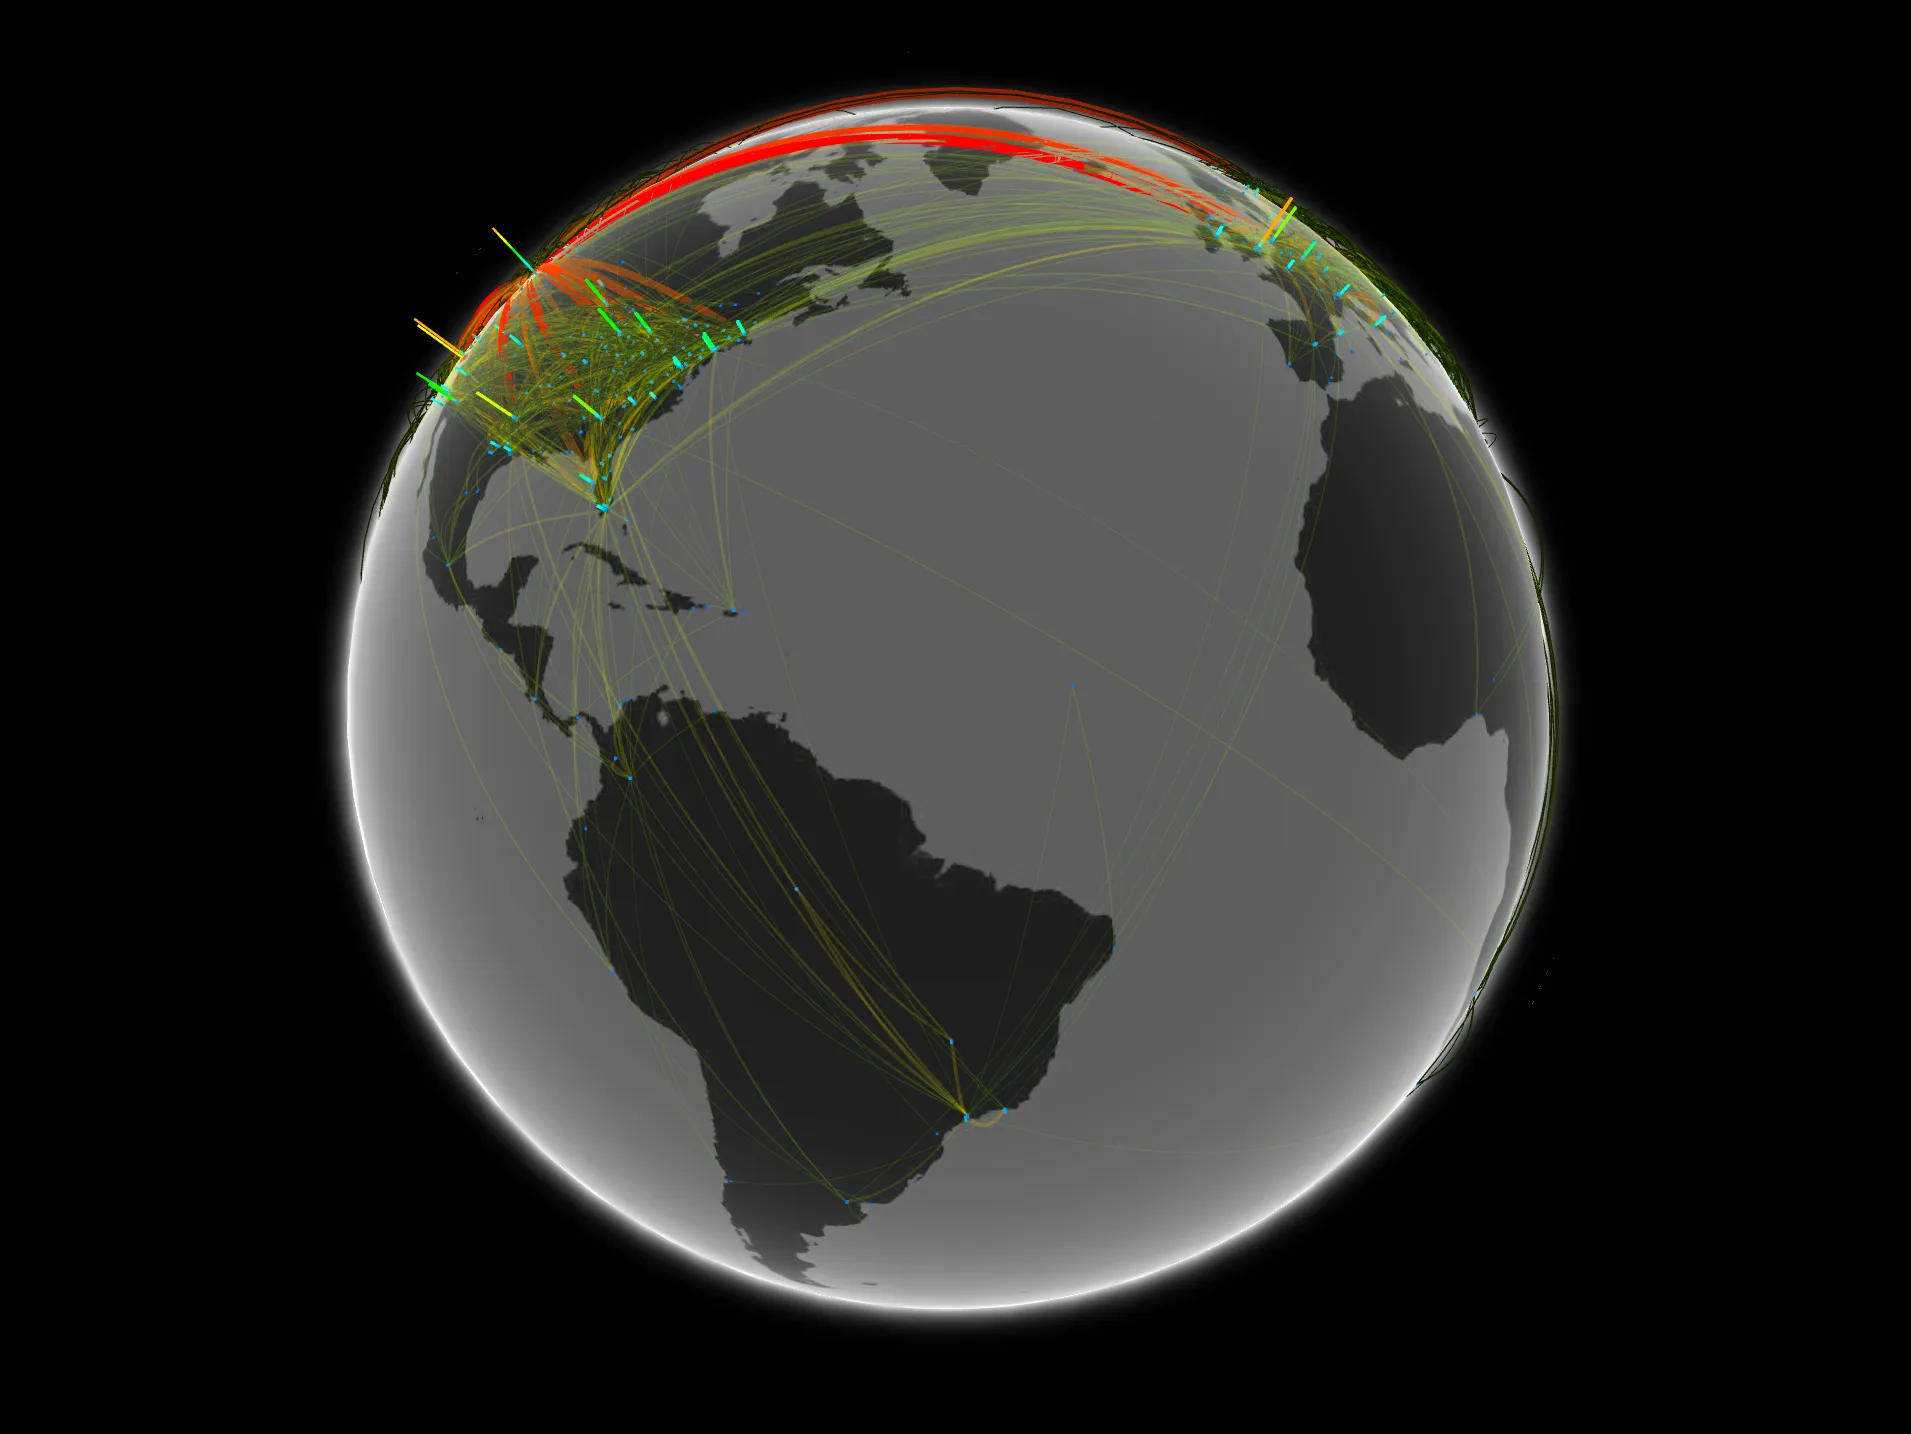
Flight Sense was Leapcraft’s analytics service for corporate travel: it read a company’s raw flight bookings and turned them into a dashboard of where its people fly, on which airlines, and how often....
With: Antoni Kaniowski , Christian Sonne
At: Leapcraft
Bike Maps
July '14
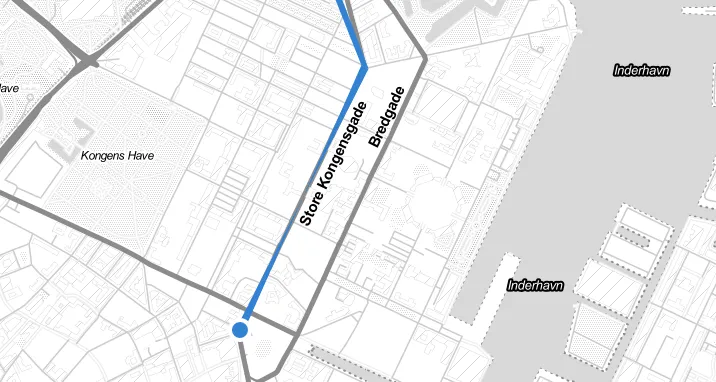
A visualisation of bicycle traffic along a Copenhagen commuter corridor, built to find the factual basis for a green wave: traffic lights timed so cyclists meet as few red lights as possible....
With: Antoni Kaniowski
At: Leapcraft
Creative Clusters Map
December '13
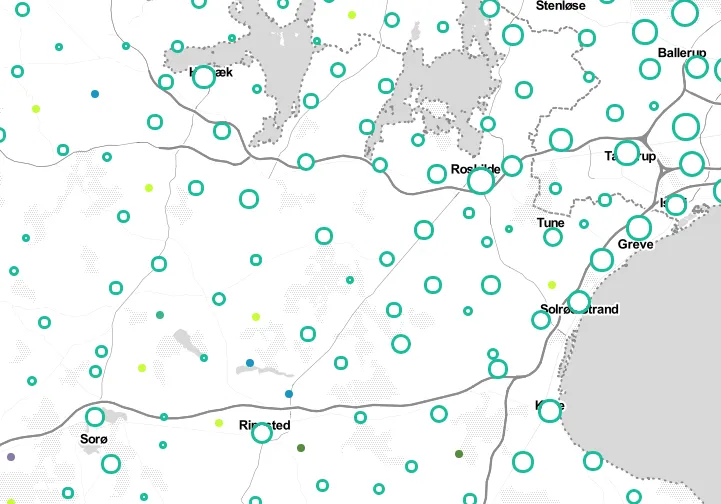
A map of where Denmark’s creative companies cluster, built from the Central Business Register (CVR), to find which areas besides the usual suspects house architecture, advertising, programming and film production firms....
With: Antoni Kaniowski
At: Leapcraft
Wind Power In Denmark 1977-2020
June '13
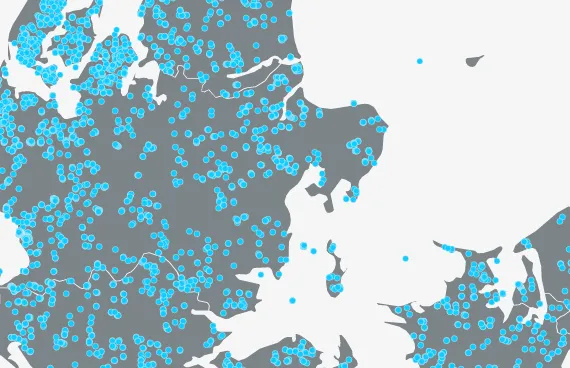
WIND ELECTRICITY IN DENMARK 1977-2020 shows patterns of wind turbines installed – and taken down – in Denmark over the years in combination with total consumption of electricity and gross energy....
With: Antoni Kaniowski
For: Kirt Thomsen
The Books of Aarhus
May '13
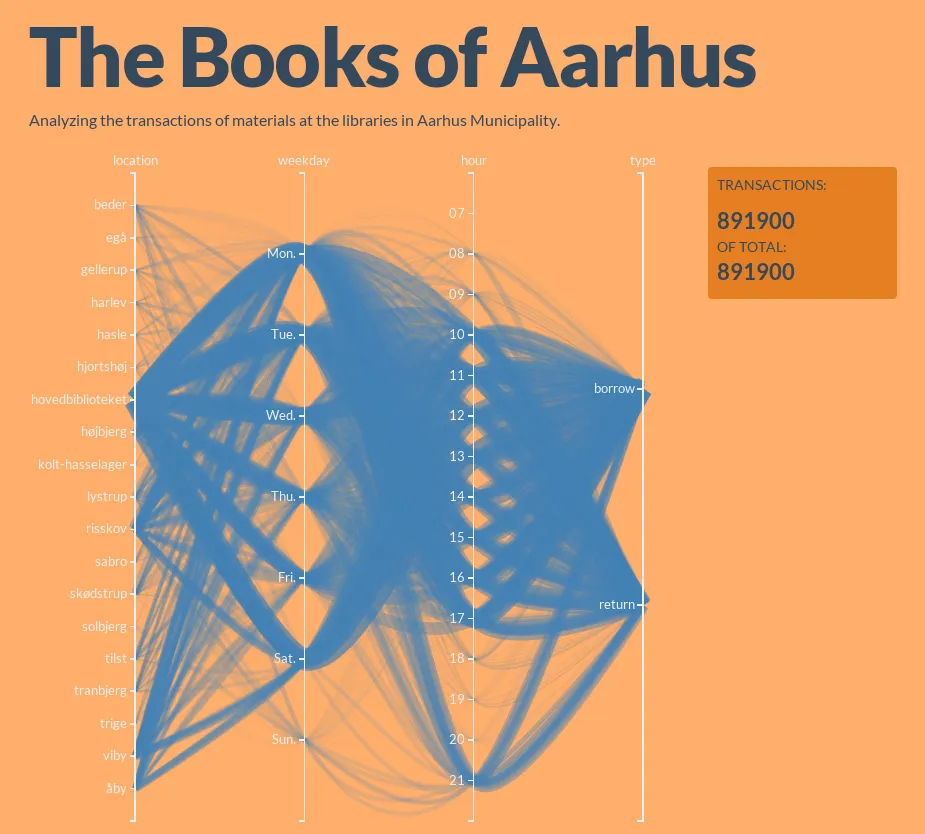
Analyzing the transactions of materials at the libraries in Aarhus Municipality. The municipality of Aarhus administrates 19 public libraries distributed throughout the greater Aarhus area. Since the beginning of 2013 the time and place of all indivi...
With: Matthias Nielsen
Vores Fart (Our Speed)
February '13
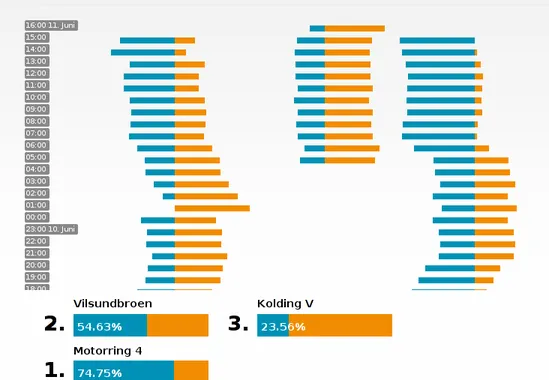
We built a data visualization based on three speed measurement spots around Denmark that would engage the media and the public in a discussion about safe driving. The chart was publicly accessible during the campaign, and was designed to invite the p...
With: Antoni Kaniowski
At: KL7
E.volution
May '12
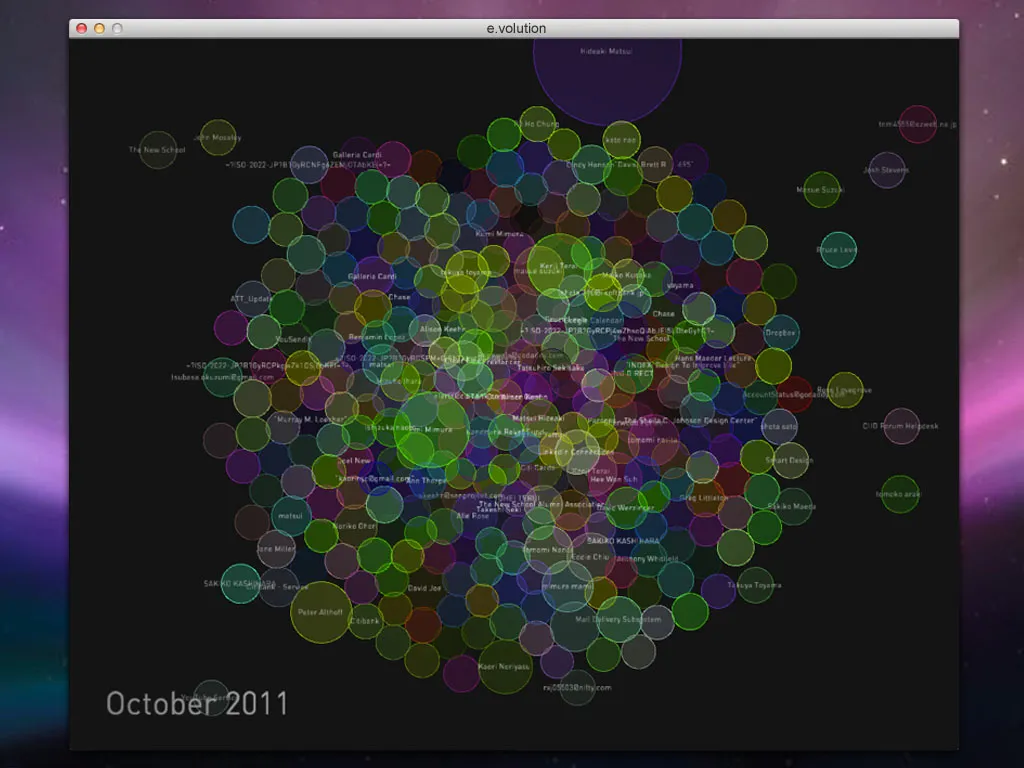
e.volution visualizes a user’s email relationships with other people through time. Aimed as an excercise in data visualisation, the visualisation was developed in processing and works with GMail accounts....
With: Hideaki Matsui
At: CIID
CityViewAR
November '11
CityViewAR is a mobile AR (augmented reality) application that allows people to see how the city was before the earthquakes and building demolitions....
For: HITLabNZ